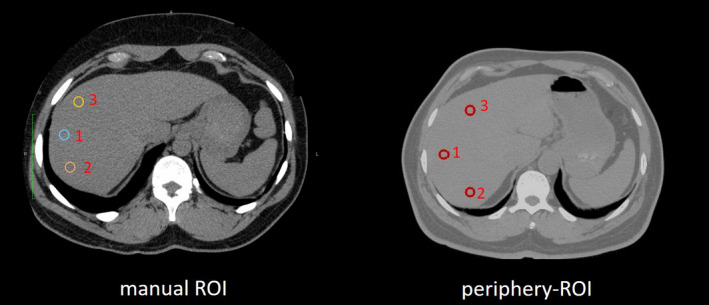
Figure 1.

The regions of interests (ROIs) of liver attenuation estimations on computed tomography. The left panel shows an example of manual ROIs, while the right panel shows the automatic three circular ROIs (periphery‐ROI) proposed in this study. [Color figure can be viewed at wileyonlinelibrary.com]
