Figure 2.

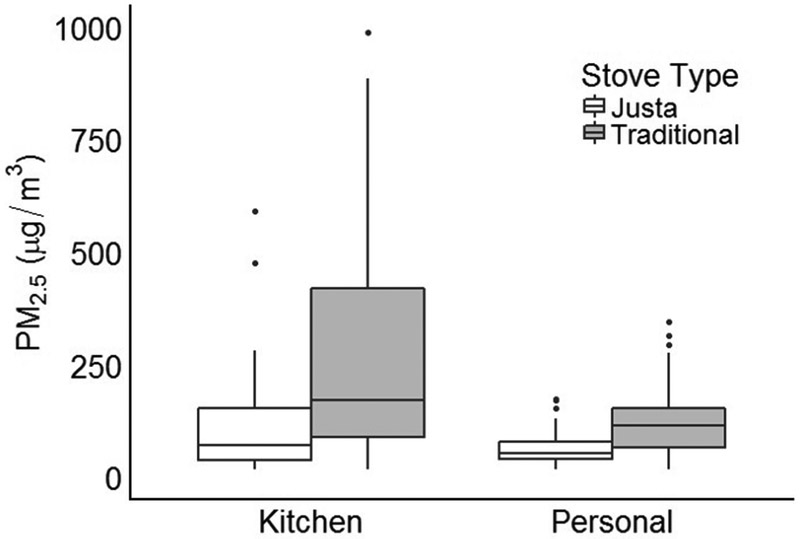
Concentrations of kitchen and PM2.5 by stove type. Boxplots are reporting minimum value, 1st quartile, median, 3rd quartile, maximum value, and outliers (four highest outliers removed from kitchen PM2.5 plots to improve scale).

Concentrations of kitchen and PM2.5 by stove type. Boxplots are reporting minimum value, 1st quartile, median, 3rd quartile, maximum value, and outliers (four highest outliers removed from kitchen PM2.5 plots to improve scale).