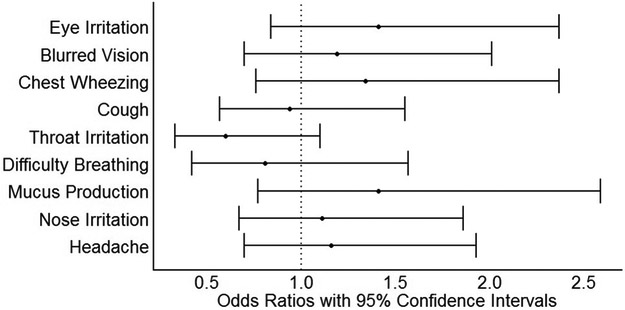
Figure 4.
Prevalence odds ratios and 95% confidence intervals for the association between symptoms and 24-hour average personal PM2.5 exposure (per IQR increase [85 μg/m3]), n = 105. All results are adjusted for age (continuous), body mass index (continuous) and household assets (dichotomous, split at median).

