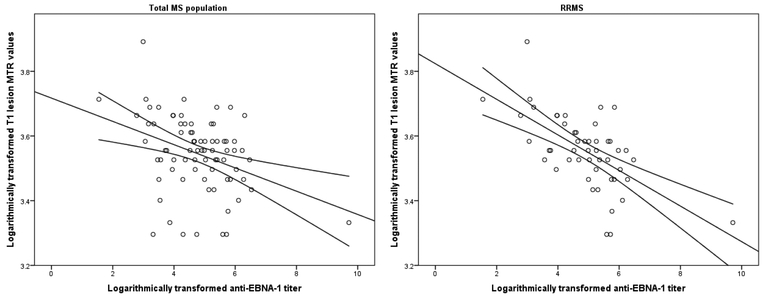
Figure 1.
Scatter-plot representation of the associations between anti-EBNA-1 titer levels and magnetization transfer ratio values of T1-hypointense lesions in all multiple sclerosis patients (left) and relapsing-remitting multiple sclerosis patients only (right)
MTR – magnetization transfer ratio, EBNA-1 – Epstein-Barr nuclear antigen-1. Due to the non-normal distribution of data, the anti-EBNA-1 titer was transformed using the natural logarithm and Pearson’s correlation is fitted.

