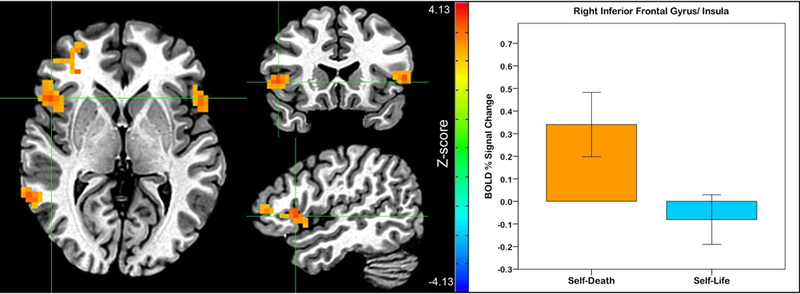
Figure 1:

Areas of greater activation during the self-death versus self-life blocks. Crosshairs are centered at the peak activation of the right inferior frontal/insula cluster: [−47 −17 3] (scale: Z-score; left=right). Graph represents extracted values of functional magnetic resonance imaging (fMRI) activation during the self-death and self-life blocks in the right inferior frontal gyrus/insula cluster (error bars = +/− 1 standard error).
