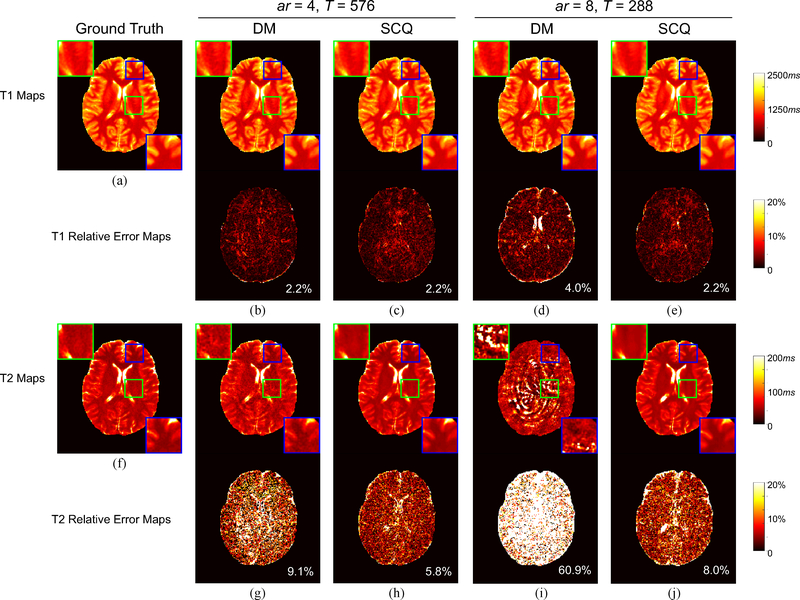
Fig. 4.
Visual results of T1 and T2 quantification by our method (SCQ) and the baseline method (DM). (a) Ground-truth T1 map. (b)-(e): Estimated T1 maps and associated relative error maps. (f) Ground-truth T2 map. (g)-(j): Estimated T2 maps and associated relative error maps. The overall error is labeled at the lower right corner of each error map. ar: acceleration rate; T: number of time points used for tissue quantification.

