Fig. 4.
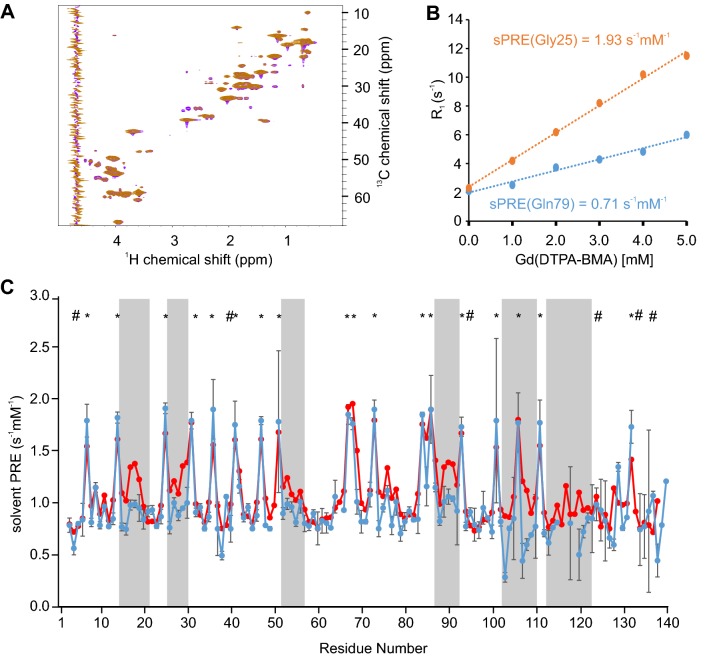
Comparison of predicted and measured solvent PRE of α-synuclein. a Overlay of 1H, 13C HSQC Read-out spectra, with full recovery time of 100 µM 13C,15N labeled α-synuclein in absence (violet) and presence of 5 mM Gd(DTPA-BMA) (orange). b Linear fit of relaxation rate 1H-R1 and Gd(DTPA-BMA) concentration of two selected residues of α-synuclein. c Predicted (red) and experimentally determined (blue) sPRE values from 1H,13C HSQC read-out spectra. Regions of strong variations between predicted and measured sPRE values are highlighted by grey boxes. Experimental sPRE values are calculated by fitting the data with a linear regression equation. Predicted sPRE values are based on the previously described ensemble approach. Residues with bulky side chains (Phe, Trp, Tyr) are labeled with #, and exposed glycine residues are labeled with * (see Supporting Fig. 2C for a bulkiness profile). Errors of the measured 1H-R1 rates were calculated using a Monte Carlo-type resampling strategy and are shown in the diagram as error bars

