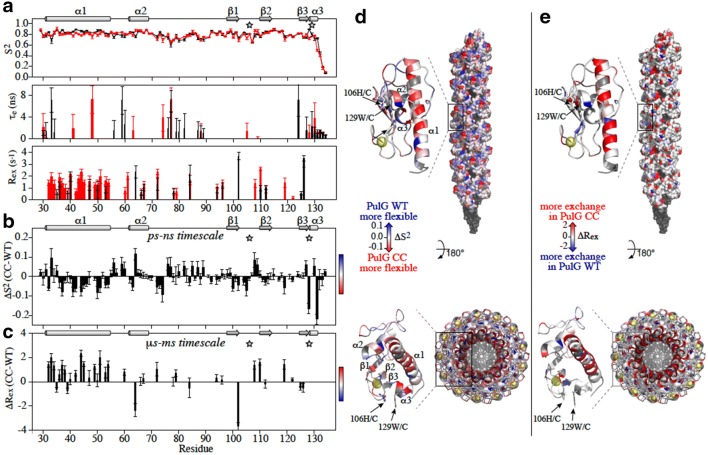
Fig. 3.
Dynamic changes on PulG monomer induced by the H106C-W129C mutation. a Dynamic parameters extracted from the 15N relaxation data at 600 MHz using the model-free formalism of Lipari-Szabo with an anisotropic global reorientation model: amplitude of the picosecond (ps) to nanosecond (ns) time scale motion (S2), internal correlation time (τe) and exchange contributions on the μs-ms timescale (Rex). The mutation positions H106C and W129C are indicated by gray stars. b, d Variation of S2 () highlighting ps–ns time scale dynamics and its mapping on the PulG monomer and pilus structure, side and top view. c, e Variation of Rex (ΔRex(CC-WT)) reflecting μs–ms timescale dynamics and its mapping on the PulG monomer and pilus structure. Blue and red indicate less or more flexibility in the mutant, respectively. The calcium atoms are displayed in yellow, only on the ribbon representation

