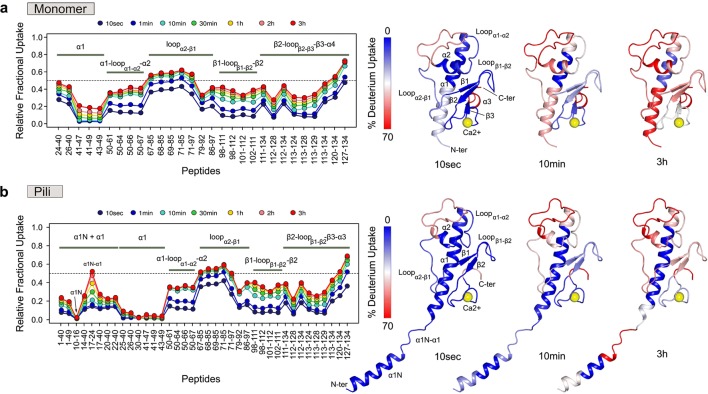
Fig. 4.
Deuterium exchange profiles of PulGWT in the monomer (a) and in the pilus (b) measured at 20 °C and pD 7.0. Relative fractional exchange values were determined at each time point and plotted as a function of peptide position (from N- to C-terminal) using MEMHDX. Each dot corresponds to an average of three independent HDX-MS experiments. The solvent accessibility measured after 10 s, 10 min and 3 h incubation is mapped onto the NMR structure of PulGWT monomer (a) and the model (b) of PulGWT pilus from the cryo-EM reconstruction

