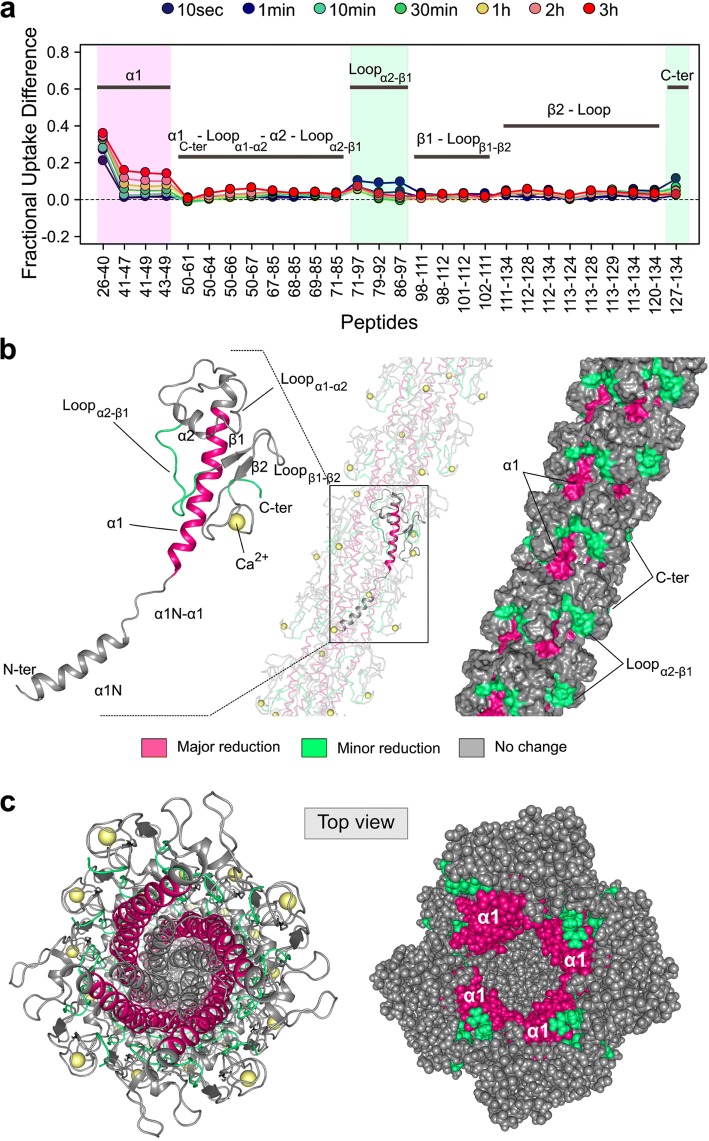
Fig. 5.
Difference of solvent accessibility between the PulGWT monomer and the pilus. a Fractional deuterium uptake difference plot showing the difference in deuterium incorporation between PulGWT monomer and PulGWT in the pilus at each time point, and for each identical peptide. A positive value indicates a reduction of solvent accessibility of PulGWT in the pilus compared to the monomer. The three regions of PulGWT showing statistically significant reduction of solvent accessibility (Wald test, p < 0.01) are mapped onto the PulG subunit and the cryo-EM pilus model (b, c). The threshold between major (pink) and minor (green) reductions of deuterium uptake was set to 10% (major reductions > 10%; minor reductions > 5% and below 10%; no change of solvent accessibility < 5%)

