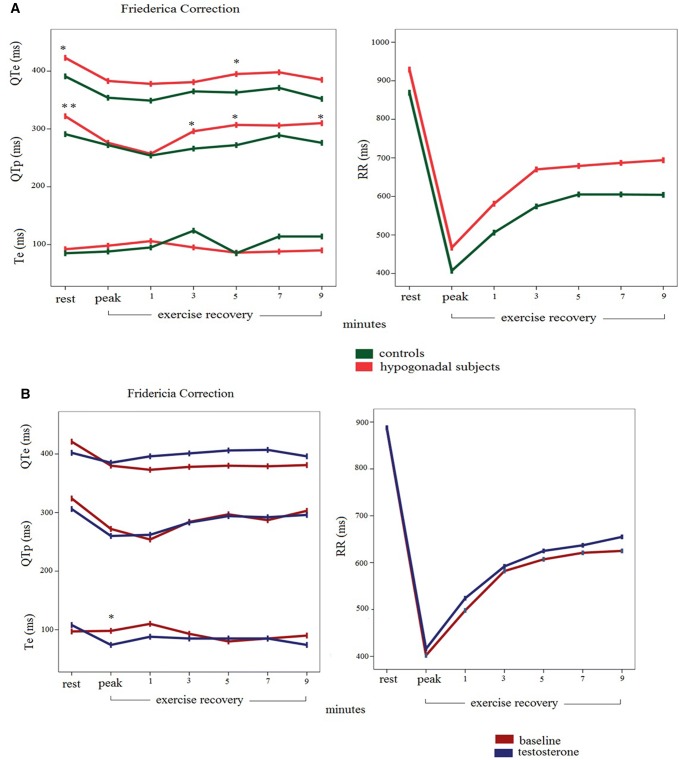
Fig. 6.
a QTe, QTp, and Te with Fridericia correction and RR intervals at rest, during the peak, the first and the 10th minute of exercise recovery in hypogonadal (red) and control subjects (green). *p < 0.05 or **p < 0.001: hypogonadal patients vs controls. b QTe, QTp, and Te with Fridericia correction and RR intervals at rest, during the peak, the first and the 10th minute of exercise recovery in hypogonadal (baseline) and during replacement therapy (blue) in hypogonadal subjects. *p < 0.05 baseline vs control. These data are detected manually with tangential method

