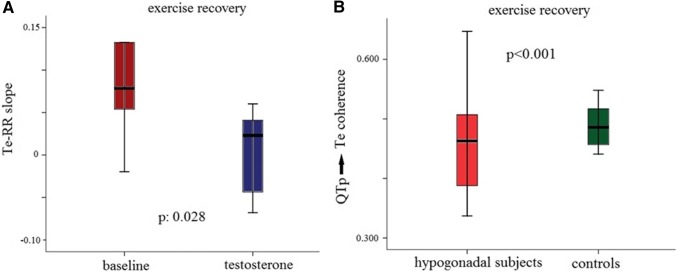
Fig. 7.
a QTp → Te during exercise recovery in hypogonadal and control subjects. In the box plots, the central line represents the median distribution. Each box spans from 25th to 75th percentile points, and error bars extend from 10th to 90th percentile points. b Te-RR slope during exercise recovery at baseline and replacement therapy in hypogonadal subjects. In the box plots, the central line represents the median distribution. Each box spans from 25th to 75th percentile points, and error bars extend from 10th to 90th percentile points. These data are detected automatically with a custom software

