
Figure 6.
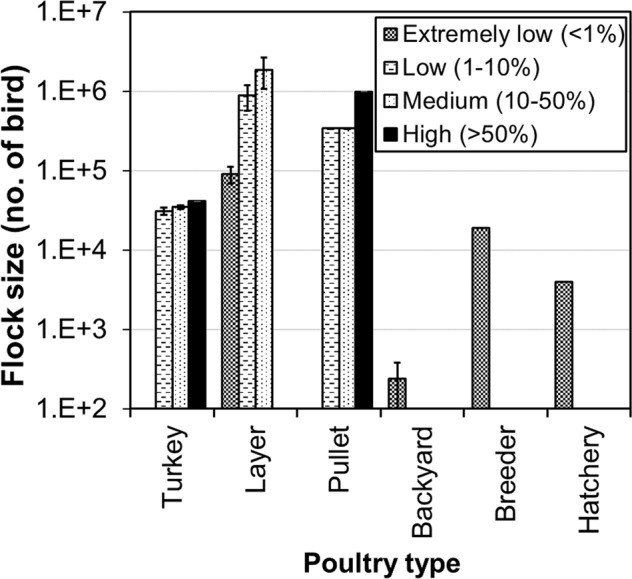
Flock sizes of infected Iowa farms at four infection risk categories. Error bars are 95% confident intervals. Combined ceiling values of virus shedding rate, emission rate, and half-life are applied.
Official websites use .gov
A
.gov website belongs to an official
government organization in the United States.
Secure .gov websites use HTTPS
A lock (
) or https:// means you've safely
connected to the .gov website. Share sensitive
information only on official, secure websites.
Flock sizes of infected Iowa farms at four infection risk categories. Error bars are 95% confident intervals. Combined ceiling values of virus shedding rate, emission rate, and half-life are applied.