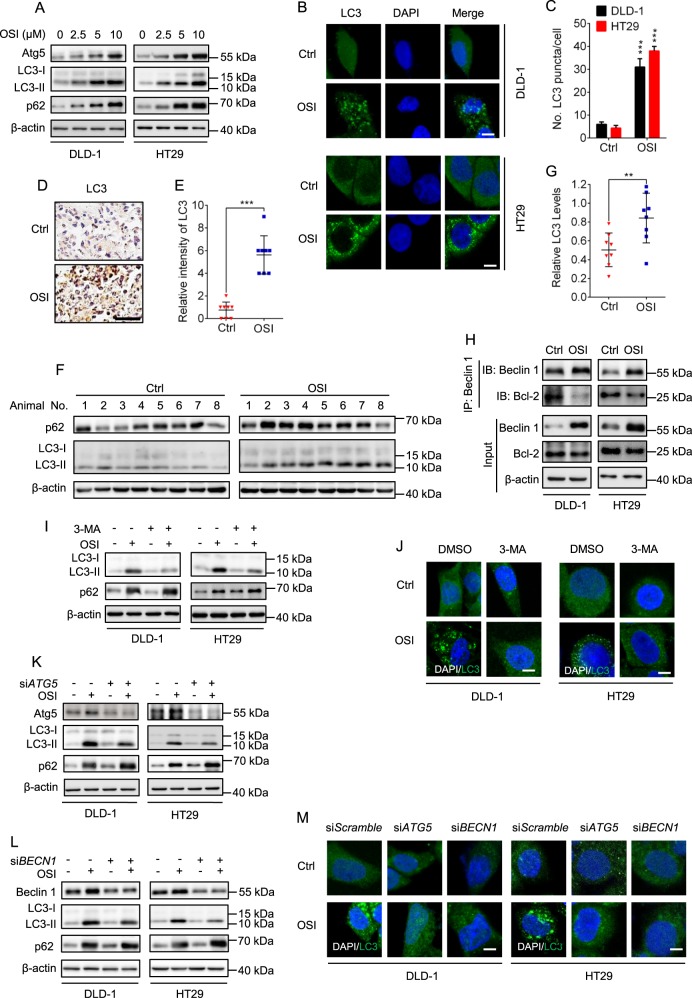
Fig. 2. OSI induces autophagy in CRC cells in vitro and in vivo.
a Immunoblotting analysis of LC3, Atg5, and p62/SQSTM1 expression in CRC cells treated with indicated concentrations of OSI for 24 h. b The formation of endogenous LC3 puncta in cells treated with DMSO or 5 μM OSI for 24 h. c Total number of endogenous LC3 puncta per cell in (b). d, e LC3 expression in xenograft tissues was examined by IHC. Representative images were provided as indicated in (d) and relative intensity of LC3 staining was quantified in (e). f Immunoblotting analysis of LC3 and p62/SQSTM1 expression in tumor xenografts (Each protein of interest from each group was electrophoretically transferred onto a PVDF membrane, incubated with indicated primary and secondary antibodies, and developed as a digital image.) g Relative intensity of LC3 in (f). h Co-immunoprecipitation analysis of the interaction between Beclin 1 and Bcl-2 in CRC cells treated with or without 5 μM OSI for 24 h. i Immunoblotting analysis of LC3 expression in CRC cells treated with or without 5 μM OSI in the presence or absence of 5 mM 3-MA for 24 h. j CRC cells were treated as in (i), the LC3 puncta were analyzed by immunofluorescence. Scale bar, 10 μm. k, l Immunoblotting analysis of LC3 expression in CRC cells transfected with siScramble, siATG5 (k), or siBECN1 (l) for 24 h, followed by treatment with or without 5 μM OSI for another 24 h. m CRC cells were treated as in (k, l). The LC3 puncta were analyzed by immunofluorescence. Scale bar, 10 μm. Data are presented as mean SEM, Student’s t-test, and are representative of 3 independent experiments. **P < 0.01; ***P < 0.001

