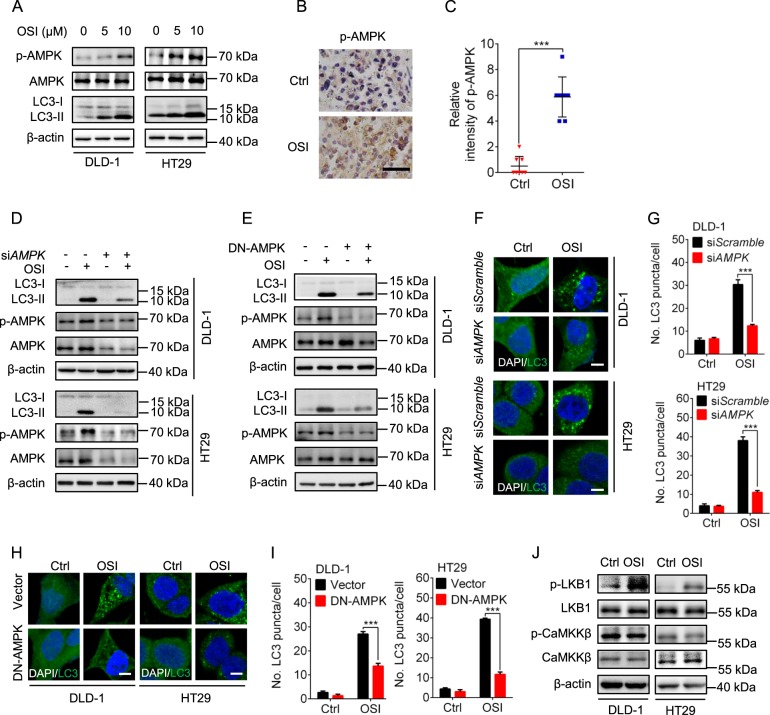
Fig. 5. OSI induces autophagy by activating LKB1/AMPK signaling in CRC cells.
a Immunoblotting analysis of AMPK, phosphorylated AMPK (Thr172) and LC3 levels in CRC cells treated with indicated concentration of OSI for 24 h. b Immunohistochemistry analysis of AMPK phosphorylation levels in xenograft tissues. Scale bar, 50 μm. c Relative intensity of phosphorylated AMPK staining in (b). d CRC cells were transfected with siScramble or siAMPK for 24 h and followed by treatment with or without 5 μM for another 24 h. LC3 and phosphorylated AMPK (Thr172) levels were detected by immunoblotting. e CRC cells were transfected with empty vector or DN-AMPK plasmid for 24 h, followed by treatment with or without 5 μM OSI for another 24 h. LC3 and AMPK phosphorylation levels were determined by immunoblotting. f CRC cells were treated as in (d), the endogenous LC3 puncta in CRC cells were assessed by immunofluorescence. Scale bar, 10 μm. g The number of LC3 puncta per cell in (f). h CRC cells were treated as in (e), the endogenous LC3 puncta in CRC cells were assessed by immunofluorescence, Scale bar, 10 μm. i The number of LC3 puncta per cell in (h). j Immunoblotting analysis of phosphorylated LKB1 and phosphorylated CaMKKβ levels in CRC cells treated with or without 5 μM OSI. Data are presented as mean SEM, Student’s t-test, and are representative of three independent experiments. ***P < 0.001

