Fig. 3.
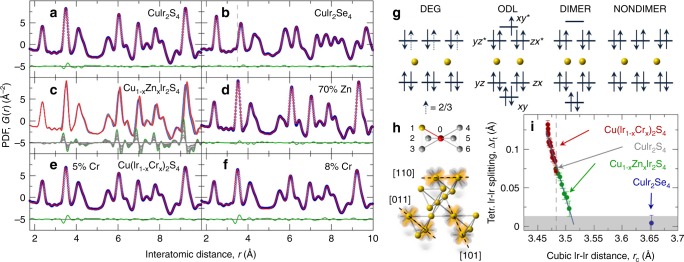
Manipulation of the ODL state. a Fit of the cubic model (red line) to the 300 K CuIr2S4 data (blue open circles). b Fit of the cubic model (red line) to the 300 K CuIr2Se4 data (blue open circles). c Compositional stack of 300 K data for Zn-substituted CuIr2S4 with Zn content ranging from 0% (blue line) to 70% (red line) in 10% increments (gray lines). The differences between the CuIr2S4 parent and all other datasets are stacked underneath, offset for clarity. The largest difference between the 0% Zn and 70% Zn datasets is shown in green, other differences in gray, evolving uniformly with Zn content. d Fit of the cubic model (red line) to the 300 K 70% Zn-substituted CuIr2S4 data (blue open circles). e, f Fit of the undistorted cubic model (red lines) to the 300 K 5% and 8% Cr-substituted CuIr2S4 data (blue open circles), respectively. g Molecular-orbital (MO) view, from left to right, of degenerate MO, degeneracy-lifted MO, dimerized, and non-dimerized Ir–Ir contacts. In the legend, DEG (Ir3.5+), ODL (Ir3.5+), DIMER (Ir4+), and NONDIMER (Ir3+). h Sketch of [1, 1, 0]-type Ir t2g overlaps (bottom) and six choices for each Ir to form an ODL state (top). i Evolution of the ODL distortion, defined as the difference of the Ir–Ir nearest neighbor distance on a pyrochlore lattice extracted from local tetragonal model, with the average Ir–Ir separation in the cubic structure. These are extracted from fits to 300 K data of Cr-substituted (red circles, 0 < x < 0.6) and Zn-substituted (green circles, 0 < x < 0.7) samples, as well as pure CuIr2S4 (gray circle) and CuIr2Se4 (blue circle). Error bars represent estimated standard uncertainties on the refined parameters. Gray shaded region marks 2σ uncertainty for detecting small tetragonal distortions by the approach utilized here. In CuIr2S4 there are 0.5 t2g holes per Ir (one hole per pair)38. Vertical gray dashed lines in b, i refer to CuIr2S4

