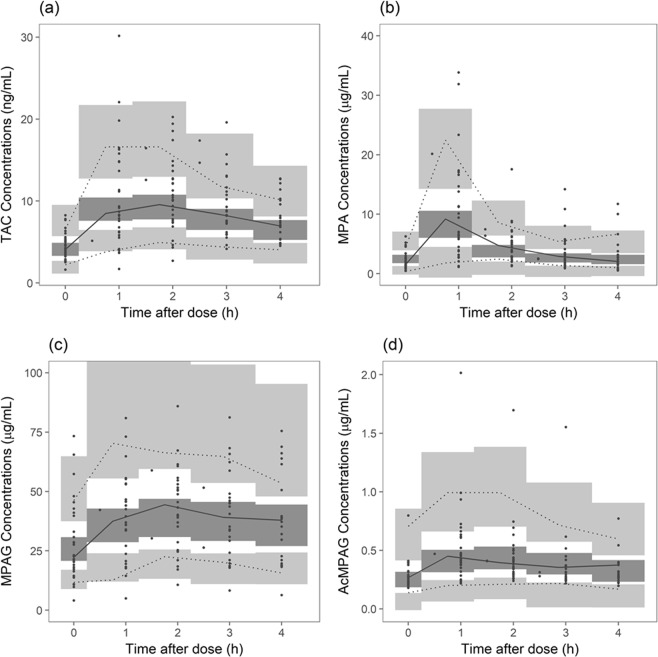
Figure 1.
Prediction-corrected visual predictive check of population pharmacokinetic models. (a) TAC; (b) MPA; (c) MPAG; (d) AcMPAG. Closed circles represent observed concentrations. Solid red line represents median of observed concentrations and solid blue line represents 5th and 95th percentile of observed concentrations. Blue area represents 95% confidence interval of 5th and 95th percentile of predicted concentrations and red area, 95% confidence interval of the median of predicted concentrations. TAC, tacrolimus; MPA, mycophenolic acid; MPAG, MPA 7-O-glucuronide; AcMPAG, MPA acyl glucuronide

