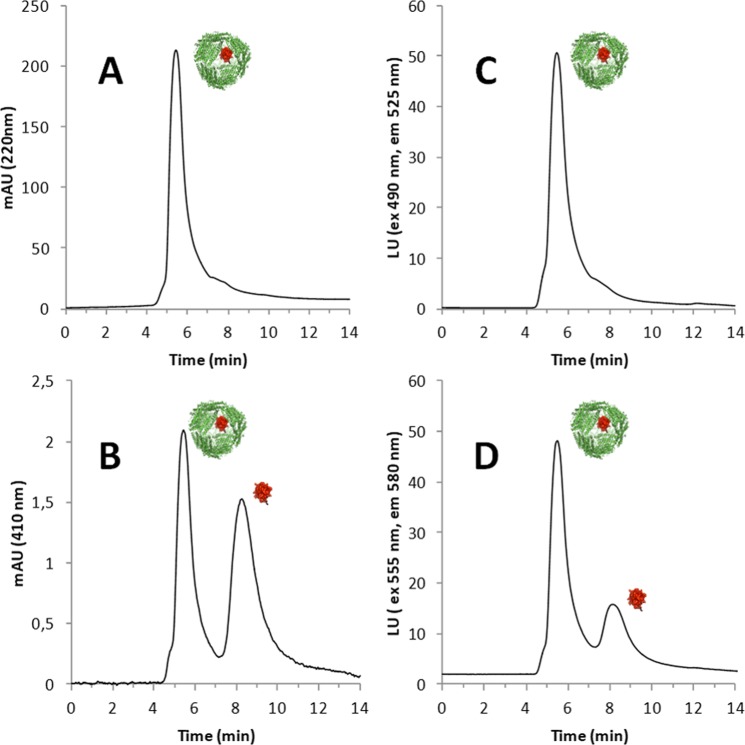
Figure 2.
HP-SEC of the complex S-CMHumFt-FITC and Cyt C-Alexa Fluor 555. (A) Elution profile of the complex followed at 220 nm: the main peak (5.8 min) corresponds to ferritin 24-mer. (B) Elution profile of the complex followed at 410 nm. At this wavelength, corresponding to the maximum absorption of Cyt C, two peaks can be detected: the first one (5.8 min) is due to Cyt c encapsulated inside the ferritin cavity (empty S-CMHumFt shows no signal at this wavelength) and the second one (8.3 min) corresponds to free Cyt C. Free Cyt C concentration is always lower than the encapsulated one. (C) Elution profile of the complex with ferritin labelled with fluoresceine (λex = 490 nm, λem = 525 nm). (D) Elution profile of the complex with Cyt C labelled with Alexa Fluor 555 (λex = 555 nm, λem = 580 nm). Even in this case two peaks can be detected: the first one (5.8 min) is due to Alexa Fluor 555 labeled Cyt C encapsulated inside the ferritin cavity (empty S-CMHumFt shows no signal at this wavelength) and the second one (8.3 min) corresponds to free labeled Cyt C.

