Figure 3.

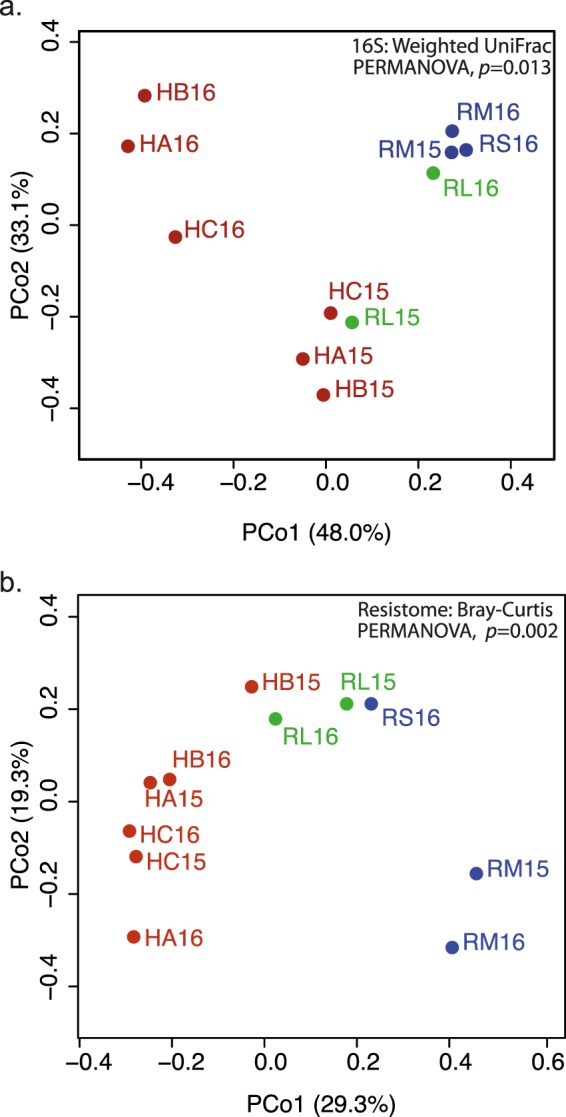
Principal coordinates analyses of taxonomic and ARG diversity. PCoAs were done with (a) weighted UniFrac distances of OTU composition and (b) Bray-Curtis distances of ARG profiles. Sample names as described in Fig. 2.

Principal coordinates analyses of taxonomic and ARG diversity. PCoAs were done with (a) weighted UniFrac distances of OTU composition and (b) Bray-Curtis distances of ARG profiles. Sample names as described in Fig. 2.