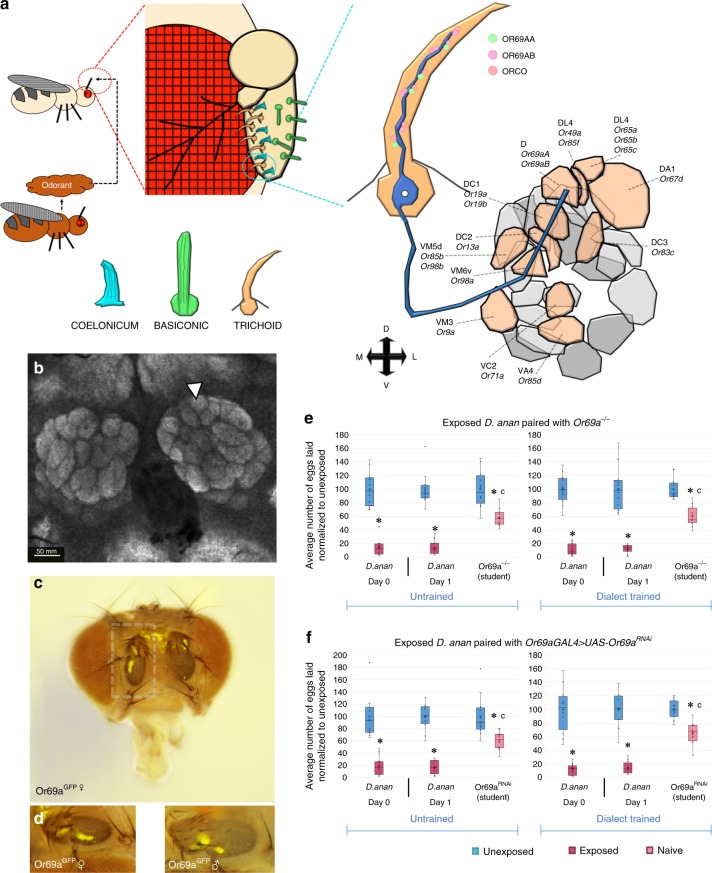
Fig. 2.
Dialect training mediated by the odorant receptor Or69a. a Schematic of Drosophila antenna which has three various olfactory detecting centers: coelonicum, basiconic, and trichoid. Or69a is highlighted in the closeup and its enervation of the D glomerulus in the antenna lobe is highlighted. Glomeruli in the same focal plane are colored orange, while glomeruli in a different focal plane are colored shades of gray. b The Drosophila antennal lobe with the D glomerulus indicated with an arrowhead. Nc82 staining shown in gray. c, d Expression of Or69a using the Or69aGFP construct highlighting expression in the antenna. Represented in (c) is a female fly head, while (d) represents magnified antennae (shown in box) of both female and male flies expressing Or69aGFP. e Percentage of eggs laid by exposed flies normalized to eggs laid by unexposed flies is shown. Or69a−/− show wild-type untrained behavior, but are unable to learn the dialect from D. ananassae following training. f Or69aGAL4 driving Or69aRNAi shows wild-type untrained behavior, but is unable to learn the dialect from D. ananassae following training. Blue lines indicate permissive temperature was used in all experiments. Trained and untrained states are labeled. Plots are standard Tukey Box Plots, where the bounds of the shaded box represent the first and third quartile; whiskers indicate the minimum and maximum data point within 1.5 times the interquartile range. Mean is denoted with an ‘X.’ Data used to generate the plots have been superimposed on the graph as open circles (n = 12 biologically independent experiments) (*p < 0.05, c → p = ns comparing trained and untrained students in experiments with no restrictive temperature)

