Fig. 6.
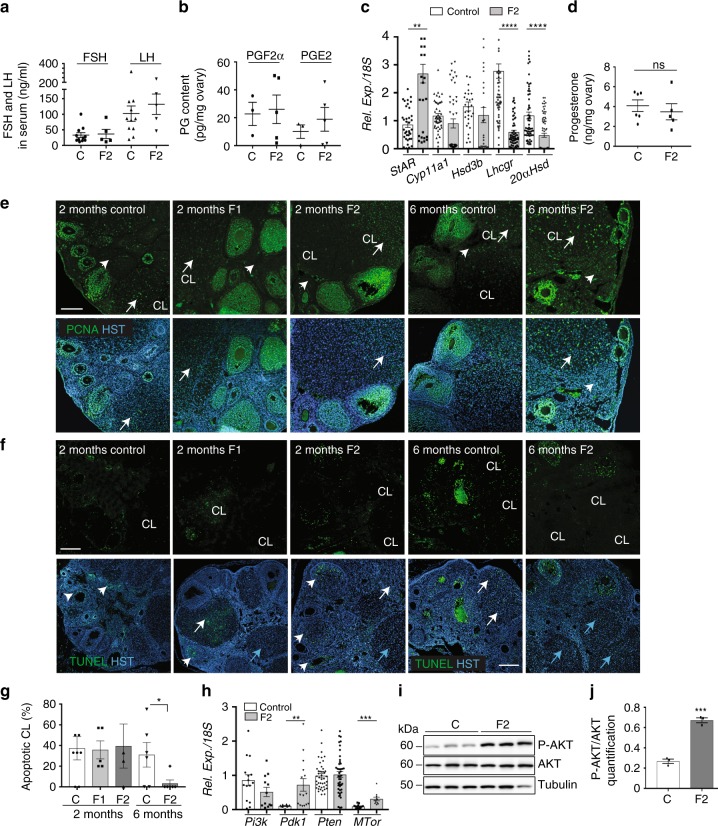
Luteolysis is impaired in 6-month-old F2 ovaries. a FSH and LH secretion in serum samples from 6-month-old ovaries measured by ELISA (n = 11 control (C) and n = 5 F2 ovaries). b PGF2α and PGE2 production in 6-month-old ovaries measured by ELISA (n = 3 control (C) and n = 5 F2 ovaries). c Relative expression levels of the steroidogenic genes StAR, Cyp11a1, Hsd3β, Lhcgr and 20αHsd in 6-month-old F2 ovaries normalised to 18S; **P < 0.01, ****P < 0.001. d Progesterone secretion was measured by LC/MS in 6-month-old control (n = 6) and F2 (n = 5) ovaries; ns not significant. e Proliferation in 2-month-old F1 and F2 and in 6-month-old F2 ovaries was assessed by immunofluorescence using anti-PCNA (green) antibody and Hoechst (HST, blue); CL = corpus luteum; white arrows highlight proliferating CLs and arrowheads indicated stromal cells. f, g Apoptotic cells in 2-month-old F1 and F2 and in 6-month-old F2 ovaries were visualised by TUNEL assay (green) and nuclear staining with Hoechst (HST, blue) (f) and apoptotic corpora lutea (CL) were counted (g); the data are presented as the percentage of apoptotic CLs. *P < 0.05 (g). White and blue arrows indicate apoptotic and non-apoptotic CLs, respectively, and arrowheads indicate growing follicles (f). Scale bars = 300 μm. h–j The AKT-PDK1 pathway is activated in 6-month-old F2 ovaries compared with controls. Relative expression levels of Pi3k, Pdk1, Pten and Mtor normalised to 18S, in control and F2 ovaries; **P < 0.01, ***P < 0.005 (h). Representative immunoblots of total AKT, phosphorylated AKT (P-AKT) and tubulin (i) show that the AKT pathway is activated in F2 ovaries (n = 3), as indicated by the increased P-AKT/AKT ratio compared with control (n = 4); ***P < 0.005 (j)

