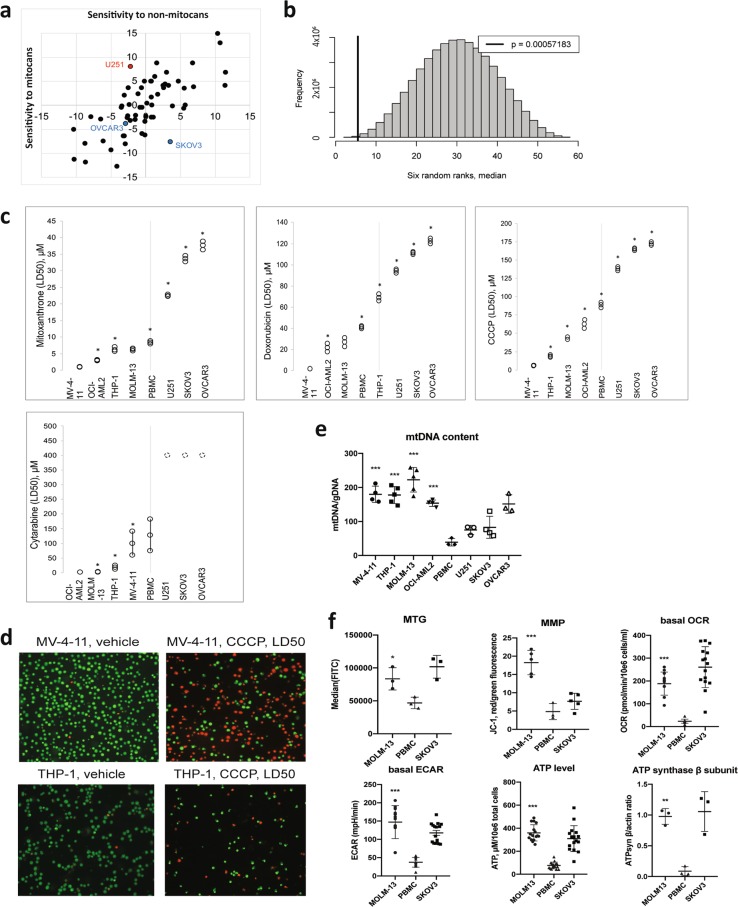
Fig. 1. Cell lines derived from AML are more susceptible to mitochondrial damage than cell lines derived from solid tumors.
a Z-scores of tumor cell lines from the NCI-60 panel. Sensitivity to non-mitocan drugs is shown on the x-axis, sensitivity to mitocans is shown on the y-axis. U251, a glioblastoma-derived cell line with high sensitivity to mitocans is shown in red, and ovarian cancer-derived cell lines, which show higher resistance, are shown in blue. b Density plot showing median rank for each possible permutation of six cell lines from the NCI-60 collection. The thick black line represents the median for leukemia cell lines (5.5) from the NCI-60 panel. c Sensitivity of AML (MV-4-11, THP-1, OCI-AML2, and MOLM-13), normal PBMCs, and solid tumor (U251, SKOV3, and OVCAR3) cell lines to mitocan treatment. Shown are LD50 values with 95% confidence intervals for MTX, DOX, CCCP, and ara-C based on results from 3–5 independent experiments. Comparisons of LD50 were done by the ratio test15, the asterisk indicates significant difference compared with the next most sensitive cell line. d Fluorescence micrographs of MV-4-11 (top) or THP-1 (bottom) cells treated with either vehicle (left) or LD50 concentrations of CCCP. Cells were stained with acridine orange/propidium iodide. e The ratio of mitochondrial to genomic DNA was determined by quantitative PCR. Shown are mean values with SD. Statistical significance for comparison AML vs. healthy PBMCs was analyzed via the Student’s t-test. f Mitochondrial health in untreated MOLM-13 cells and normal PBMCs were compared, including mitochondrial mass (assessed via staining with MitoTracker Green), membrane potential (assessed via staining with JC-1), metabolic rate (assessed via Seahorse analysis of oxygen consumption rate and lactate production), steady-state ATP level, and protein level of the β subunit of ATP synthase. SKOV3, a mitocan-resistant cell line, is shown as a comparison. Shown is the mean of at least three independent experiments (in case of Seahorse data and ATP measurements dots represent all technical replicates), error bars are SD. Statistical analysis was performed using Student’s t-test with independent samples. ***p < 0.001; **p < 0.01; *p < 0.05

