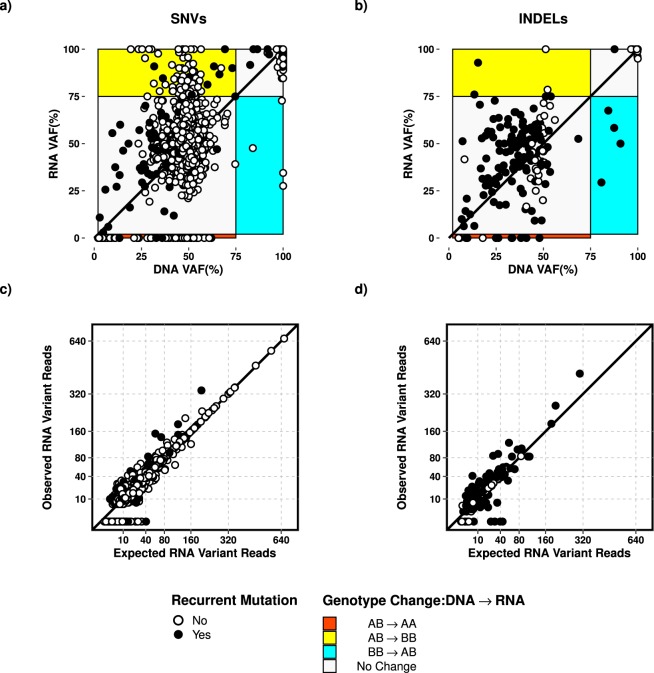
Figure 3.
Variant allele frequency differences of transcribed and DNA-exclusive variants (2,606) including recurrent mutations (284) for SNVs (a) and INDELs (b). Expected and observed RNA variant read depths of SNVs (c) and INDELs (d). The diagonal lines represent the expected DNA vs. RNA trend in terms of VAFs (a,b) and RNA variant read depths (c,d). The genotype conversion of AB → AA and AB → BB represent the allele specific transcript abundance of wild-type and mutant allele, respectively. The observation of BB → AB genotype change artefacts might be due to the arbitrary definition of homozygous and heterozygous variants. We excluded regions with DNA VAF < 2% and regions with BB → AA genotype change.

