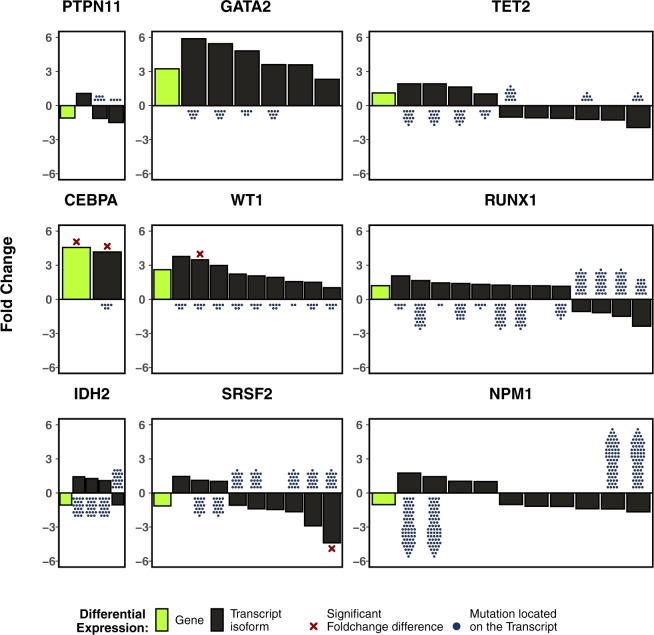
Figure 7.
Gene-level and transcript-level differential expression calculated with limma after precision-weighting with voom for all recurrently mutated genes with a significant WAI in the AMLCG cohort. The green boxes indicate gene fold change and black boxes indicate different transcript isoforms. Dots below or above the bars represent recurrent mutations present within the transcripts. Crosses represent significant fold change differences (adjusted p value < 0.05). This plot is to provide a visual representation of significant fold change difference and the location of mutations within the transcripts and thus the transcript identifiers were removed.

