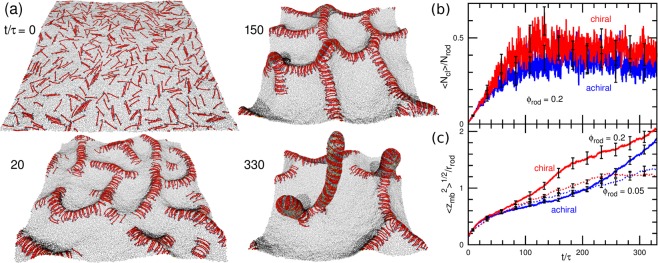
Figure 4.
Tubulation from tensionless flat tensionless membrane. (a) Sequential snapshots for the high rod density ϕrod = 0.2 and Crodrrod = 2.5 at t/τ = 0, 20, 150, and 330. (b,c) Time development of (b) mean cluster size and (c) vertical membrane span . The red and blue lines show the data for the chiral and achiral rods, respectively. The solid lines show the data for ϕrod = 0.2 and Crodrrod = 2.5. The dashed lines in (c) show the data for the low density ϕrod = 0.05 and Crodrrod = 3.

