Fig. 1.
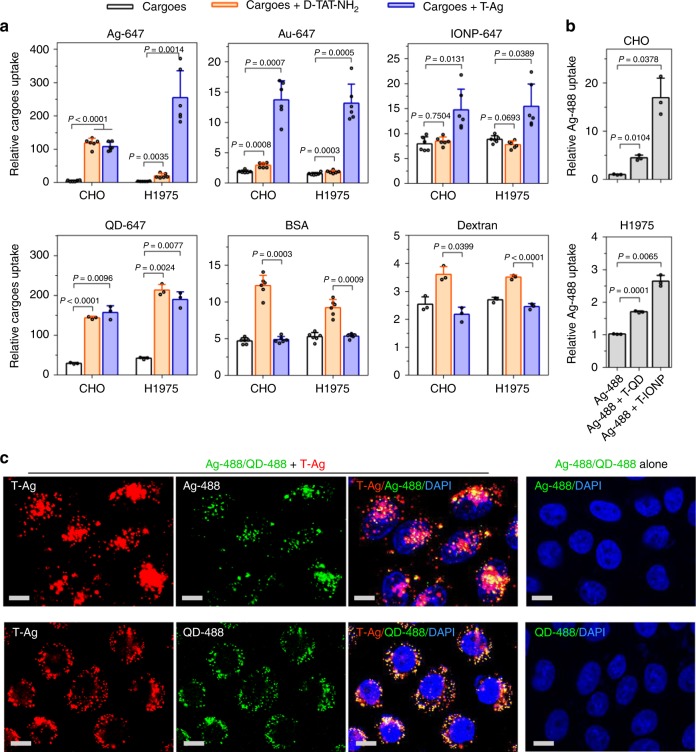
Bystander uptake induced by T-NPs. a T-Ag or D-TAT-NH2 peptide was mixed with the indicated bystander cargo for internalization in CHO and H1975 cells. After etching or washing, the fluorescence intensity of internalized bystander cargo per cell was quantified using flow cytometry and normalized to that of cells alone (n = 6 for Ag-647, Au-647, IONP-647 and BSA; n = 3 for QD-647 and dextran). b The bystander activity of T-QD and T-IONP to Ag-488 in the indicated cell lines. The fluorescence intensity per cell of internalized bystander Ag-488 was normalized to that of cells incubated with Ag-488 alone (n = 3). All quantified data were analyzed using one-way analysis of variance (ANOVA) with Tukey’s multiple comparisons test and are expressed as mean ± s.d. One-way ANOVA, a CHO (Ag-647), F = 157.63, P < 0.0001; H1975 (Ag-647), F = 55.31, P = 0.0007; CHO (Au-647), F = 68.46, P = 0.0004; H1975 (Au-647), F = 90.38, P = 0.0002; CHO (IONP-647), F = 14.884, P = 0.0065; H1975 (IONP-647), F = 13.86, P = 0.0120; CHO (QD-647), F = 144.8, P = 0.0067; H1975 (QD-647), F = 291.76, P = 0.0004; CHO (BSA), F = 126.66, P < 0.0001; H1975 (BSA), F = 68.50, P < 0.0001; CHO (dextran), F = 40.29, P = 0.0229; H1975 (dextran), F = 177.52, P = 0.0047. b CHO, F = 35.72, P = 0.0262; H1975, F = 184.47, P = 0.0049. c Confocal images of CHO cells after incubation with T-Ag and the indicated bystander NPs. Three independent experiments (n = 3) were performed and representative images are shown here for Ag-488 (upper) or QD-488 (bottom). Scale bars, 10 µm. Source data are provided as a Source Data file

