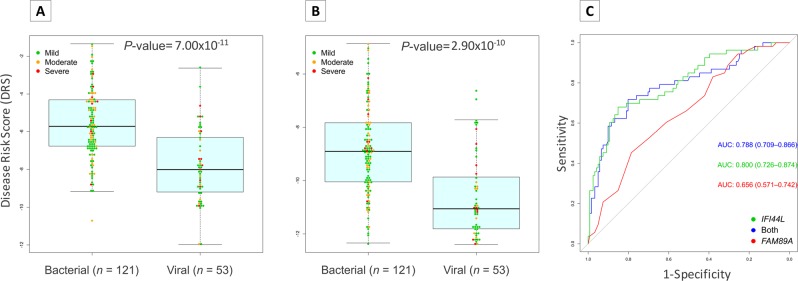
Figure 5.
Evaluation of DRS test performance in whole transcript data from bacterial and viral diarrhea patients. (A) Boxplot of DRS values using 1-transcript signature (IFI44L). (B) Boxplot of DRS using 2-transcript signature. Dots indicate disease severity. Dots indicate disease severity. (C) ROC curves generated from 2-transcript (blue) and 1-transcript ([IFI44L; green], [FAM89A; red]) DRS with AUC values and 95% CI. We used a t-test to evaluate statistical differences in DRS values between bacterial and viral patients in panels (A,B). The box represents the interquartile range (25th to the 75th) containing the middle 50% of the data, the line in the box represents the median, and the whiskers represent the ranges for the bottom 25% and the top 25% of the data values, excluding outliers.

