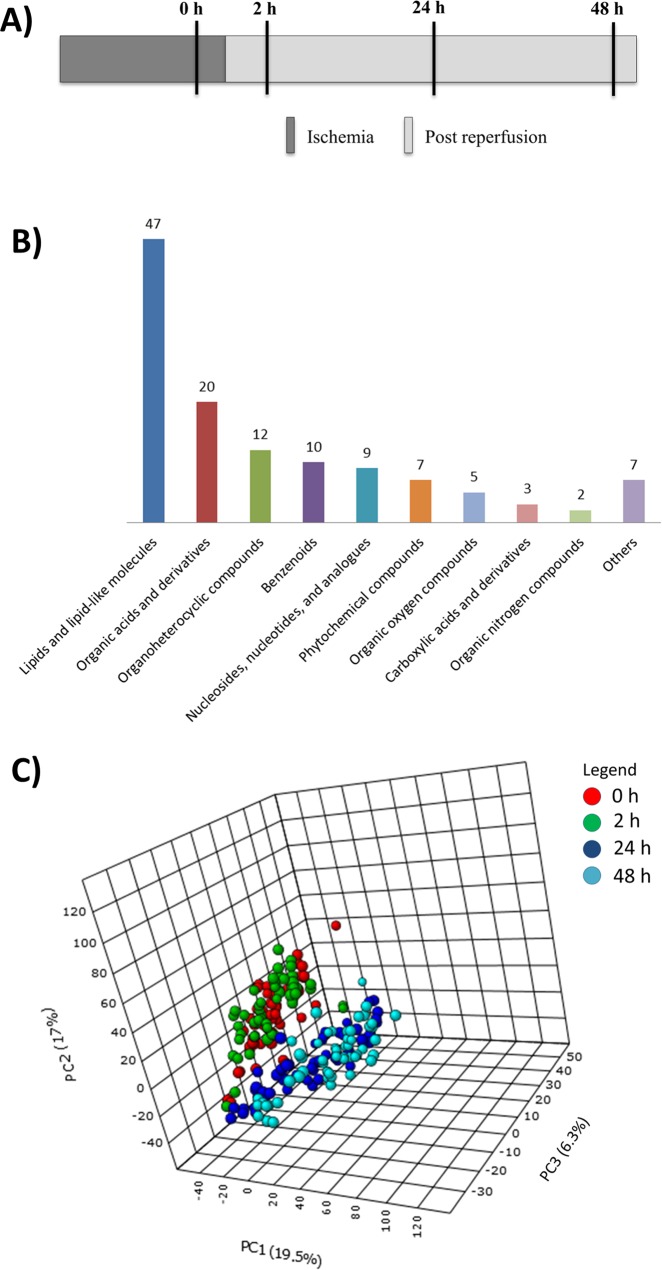
Figure 1.
(A) Overall study design: The samples were collected by venipuncture at four different time intervals including the time of arrival at the cardiac catheterization laboratory for primary PCI (0 h ischemic condition (pre angioplasty)), 2 h post angioplasty (time-2), 24 h post angioplasty (time-3), and 48 h post angioplasty (time-4). (B) Metabolite classification based on chemical taxonomy: The number of metabolites from each metabolite super family of those identified (p < 0.001) in the analysis. (C) PCA plot of samples across different time intervals: PCA score plot showing a clear separation between samples from initial time points (0 h, 2 h) and final time points (24 h, 48 h). Also, it shows a close association among the samples of initial time points (0 h, 2 h) and final time points (24 h, 48 h).

