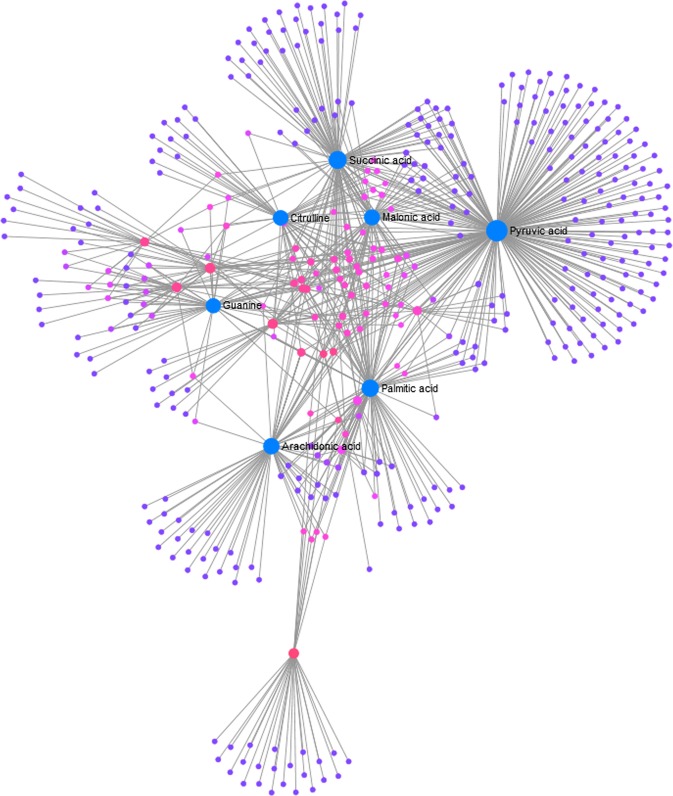
Figure 5.
Network plot highlighting the highly correlated metabolites: The nodes represent metabolites and edges represent biochemical reactions. Only significant (|r| > 0.9) correlations are drawn. The blue nodes represent the most significant hub nodes in establishing connection between the sub-networks in the flow of information. Pyruvic acid, Succinic acid, Malonic acid, Palmitic acid and Arachidonic acid constitute the most significant sub nodes.

