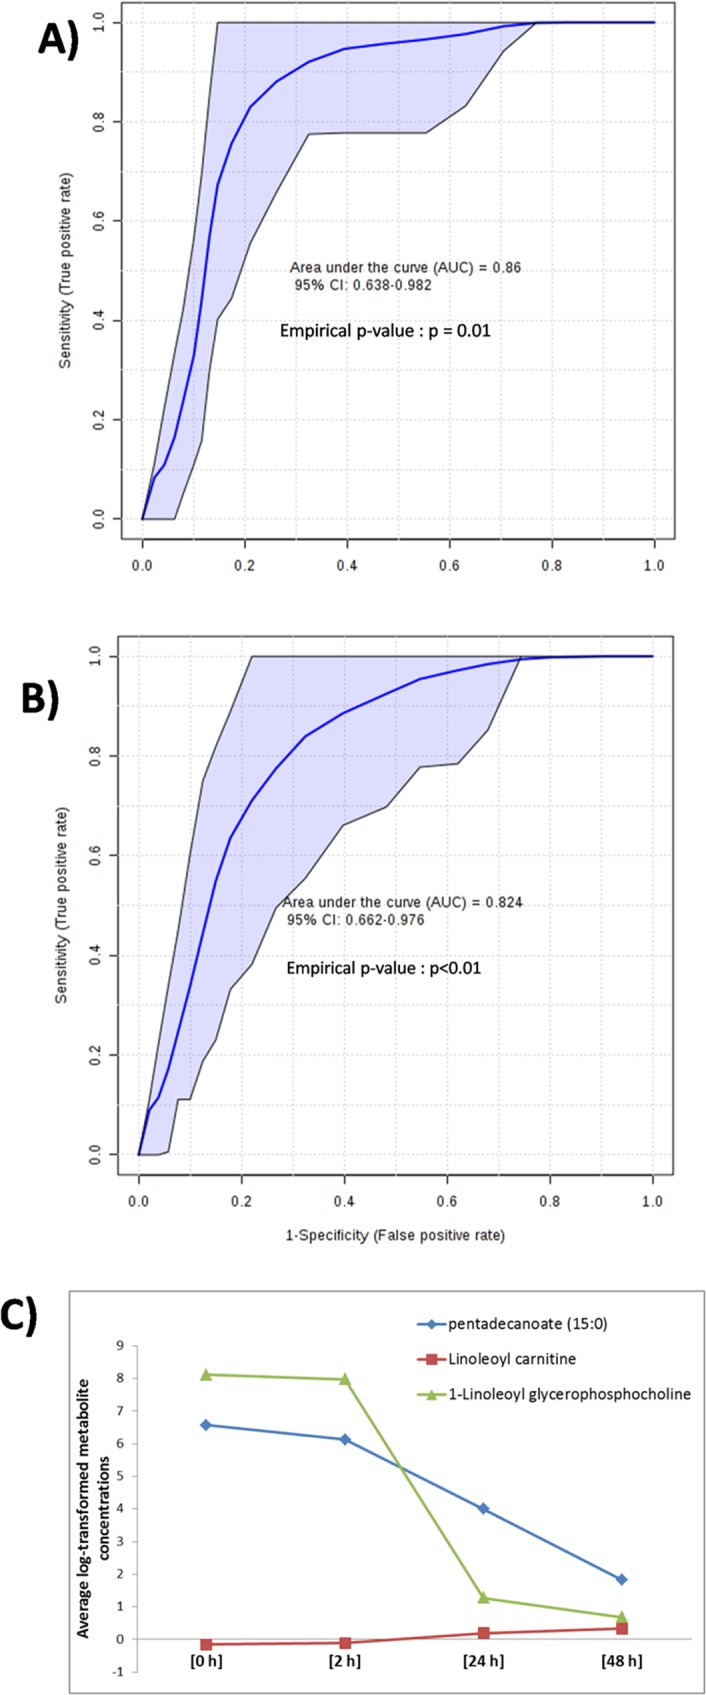
Figure 7.

Multivariate ROC plots based on the troponin and creatine kinase (CK) concentration. (A) Receiver operating characteristic (ROC) plot obtained by combining three metabolites namely pentadecanoic acid, linoleoyl carnitine and 1-linoleoylglycerophosphocholine. The curve is based on the median troponin value of the cohort (Peak TnT) and is represented by an area under the curve (AUC) of 0.86 indicating good predictive ability. (B) The multivariate ROC curve discriminates individuals based on the median creatine kinase value (Peak CK). The curve is represented by area under the curve (AUC) of 0.82 indicating good predictive ability. The empirical p-value (p-value < 0.05) shows the statistical significance of these biomarker models. (C) The line plot shows the relative concentration of three potential metabolic biomarkers across different time intervals.
