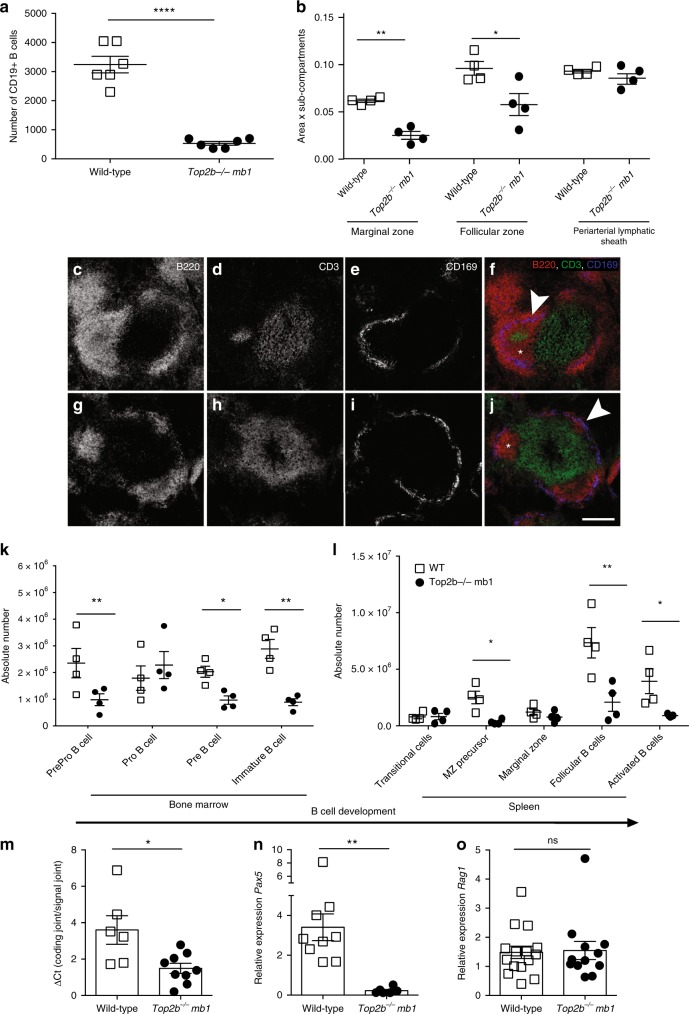
Fig. 3.
B-cell development is negatively affected in the absence of TOP2B. a Absence of TOP2B in B cells results in reduced CD19+ B cells in peripheral blood compared to littermates (n = 6 WT and 7 Top2b−/− mb1 cre mice per group, mean ± SEM, ****p < 0.0001). b Splenic white pulp subcompartments are reduced in size in the absence of Top2b. Area of three sub-compartments were evaluated in at least ten follicles across three sections (500 μM apart) with marker indicating average per mouse. (Mean SEM, *p < 0.05). Representative follicles from wildtype (c–f) and Top2b−/− mb1-cre spleens (g–j) show altered splenic architecture. More B220-expressing (red) cells are seen in the wildtype (c, f) than Top2b−/− mb1-cre mice (g, j). The metallophilic macrophages (blue) indicating the border between marginal zone and follicular region. The periarteriolar lymphoid sheath (PALS) subcompartment contains T cells (green). Scale bar indicates 200 µm. Bone marrow (k) and spleen (l) cells were isolated from wildtype and Top2b−/− mb1-cre mice. Flow cytometry demonstrates that the bone marrow of Top2b−/− mb1-cre mice have fewer PrePro B cells (Fr. A, B220+, CD43−, BP1−, CD24−), Pre B cells (Fr. D, B220+, CD43−, IgD−, IgM−), and immature B cells (Fr. E, CD19+, B220+, CD43−, IgM+, IgD−) compared to controls (k). In the spleen (l), there are overall fewer B cells with reductions in marginal zone precursors (CD19+, B220+, IgMhi, IgDhi, CD21/35+), follicular (CD19+, B220+, IgMlo, IgDhi, CD38+), and activated (CD19+, B220+, IgDhi, IgMhi, Flt3+) B cells compared to controls. (n = 4 mice per group, mean ± SEM, absolute numbers calculated from whole tissue numbers). *p < 0.05; **p < 0.01. m qPCR analysis of kappa-deleting recombination excision circles demonstrate that B cells isolated from Top2b−/− mb1-cre mice have reduced replication in the spleen (n = 6 WT or 9 Top2b−/− mb1 cre mice, shown as mean ± SEM). *p < 0.05. n Pax5 is significantly decreased in B cells isolated from Top2b−/− mb1-cre mice (n = 9 WT or 6 Top2b−/− mb1- cre mice), whereas Rag1 expression (o) is unchanged (n = 5 WT and 4 Top2b−/− mb1- cre mice per group shown as mean ± SEM, with technical triplicates), **p < 0.005). All by two-tailed Student’s t test

