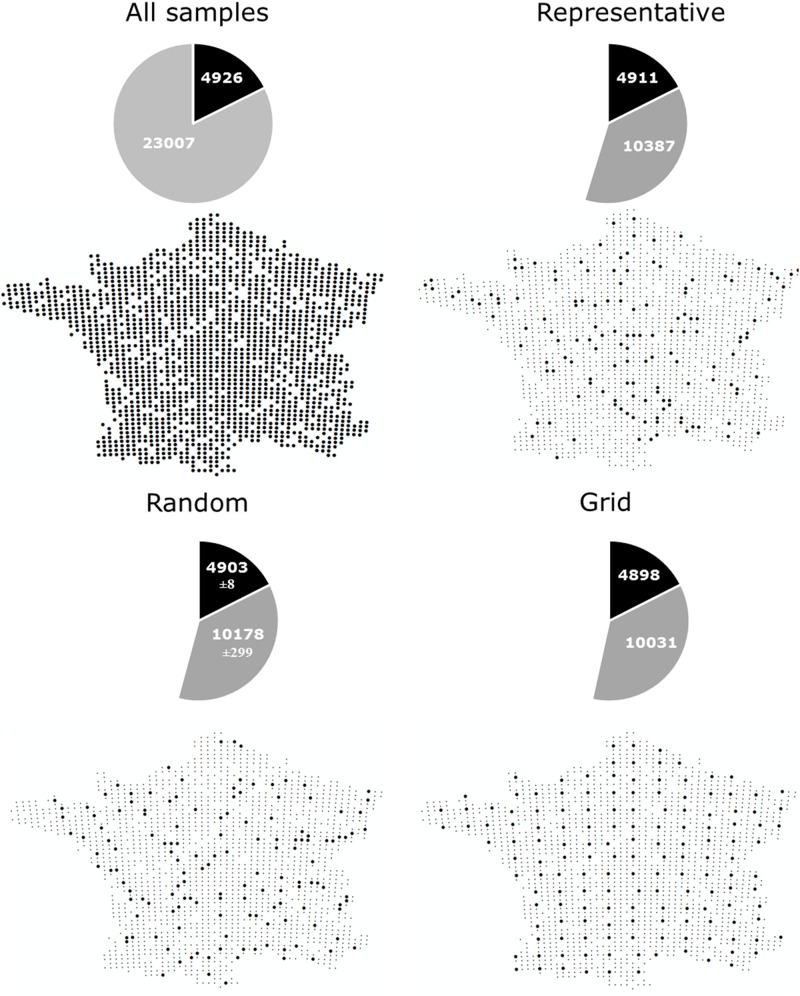
FIGURE 2.
The number of common (> 0.001% of total reads) and rare (< 0.001% of total reads) OTUs captured by different sampling approaches; All samples: Locations of samples comprising the complete dataset which we subsampled, containing 1798 samples collected on a 16 km grid (Terrat et al., 2017), Representative: Sampling described by Orgiazzi et al. (2018) to capture a range of different land uses, soil properties and climatic conditions (n = 144), Random: 144 samples randomly selected from the complete dataset (100 permutations were used and the average ± standard deviation is given), Grid: 151 samples collected in an approximate grid format.

