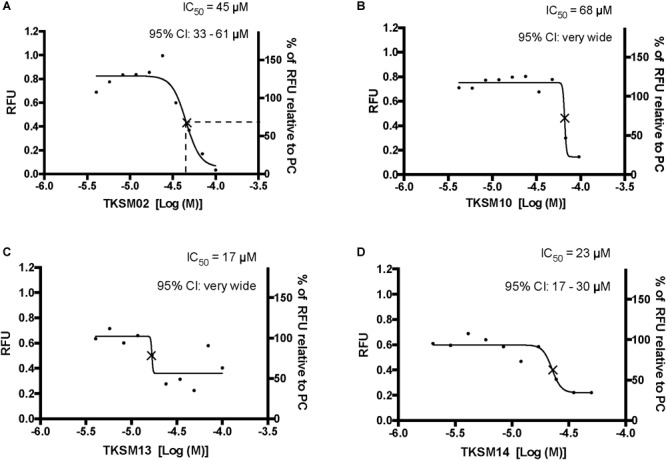
FIGURE 5.

Four small molecules antagonized the tick kinin receptor activity. Only four molecules out of the 10 tested exhibited antagonistic activities. (A–D) Dose-responses of the tick kinin receptor (in the BMLK3 cell line) to small-molecule ligands of mammalian neurokinin receptors were measured in a calcium fluorescence assay. Ten dosages were applied for each compound, starting from 100 μM (except TKSM14, starting from 50 μM) and following a 1:1.4 dilution series. The antagonist activity of 10 selected small molecules was tested by first dispensing the blank buffer or small molecules at various concentration [Log (Molar) on the X-axis] from the library plate into the assay plate. This was followed by incubation with the cells for 5 min, after which the kinin agonist (1 μM FFFSWGa) of the tick kinin receptor was dispensed into all wells and incubated for another 5 min. The end-point relative fluorescence units (RFU) from each well was represented as the average RFU (left Y-axis) of two end-point reads obtained by inverting the orientation of the plate in a Varioskan LUXTM (Thermos Scientific, Waltham, MA, United States) plate reader. Additionally, the right Y-axis represents the percentage of RFU relative to the averaged responses from cells to the PC (blank buffer + agonist). Non-linear dose-response curves IC50s were defined as the concentration of antagonist that inhibits agonist response in the mid-range of its respective fitted dose-response curve and they are marked with a cross (×) on the curve. The IC50s and corresponding 95% confidence intervals of IC50S were calculated with “log(inhibitor) vs. response- Variable slope (four parameters)” in GraphPad 6.0. The IC50s shown here are not the concentrations that inhibit 50% of the agonist response.
