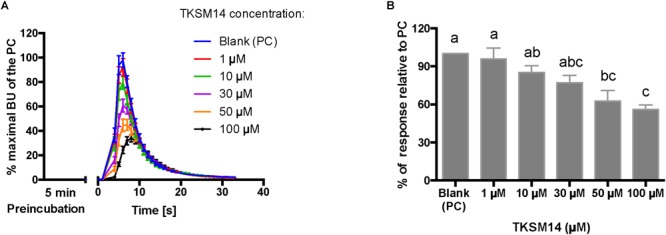
FIGURE 7.

BMLK3 preincubation (5 min) with dosages of TKSM14 before agonist addition, enhances its antagonistic activity in the calcium bioluminescence assay. (A) The kinetic responses of BMLK3 cells to the agonist (1 μM FFFSWGa) after being incubated with various concentrations of TKSM14 (1–100 μM) or blank solvent for 5 min. The response was recorded for 30 s at 1 s intervals by the ClariostarTM plate reader (BMG LABTECH). The kinetic response is represented as the percentage of the maximal bioluminescence units (BU) of the positive control (PC = blank buffer + agonist, blue curve) in each assay (Mean ± SEM, n = 9–10 wells from three independent assays). (B) The total cellular response in each well is expressed as the percentage of the average BU (per second) obtained in the 30 s relative to the average response units to the PC in 30 s. Three independent assays were performed. Responses from each assay were calculated as the average of individual responses from 3-4 pseudo-replicate wells (Y axis: mean ± SEM). Statistical differences in inhibitory activities between different treatment were analyzed by one-way ANOVA (n = 3) followed by Tukey’s multiple comparison test (p ≤ 0.05) with GraphPad 6.0 (GraphPad Software, La Jolla, CA, United States). Bars with different letter superscripts indicate significant differences.
