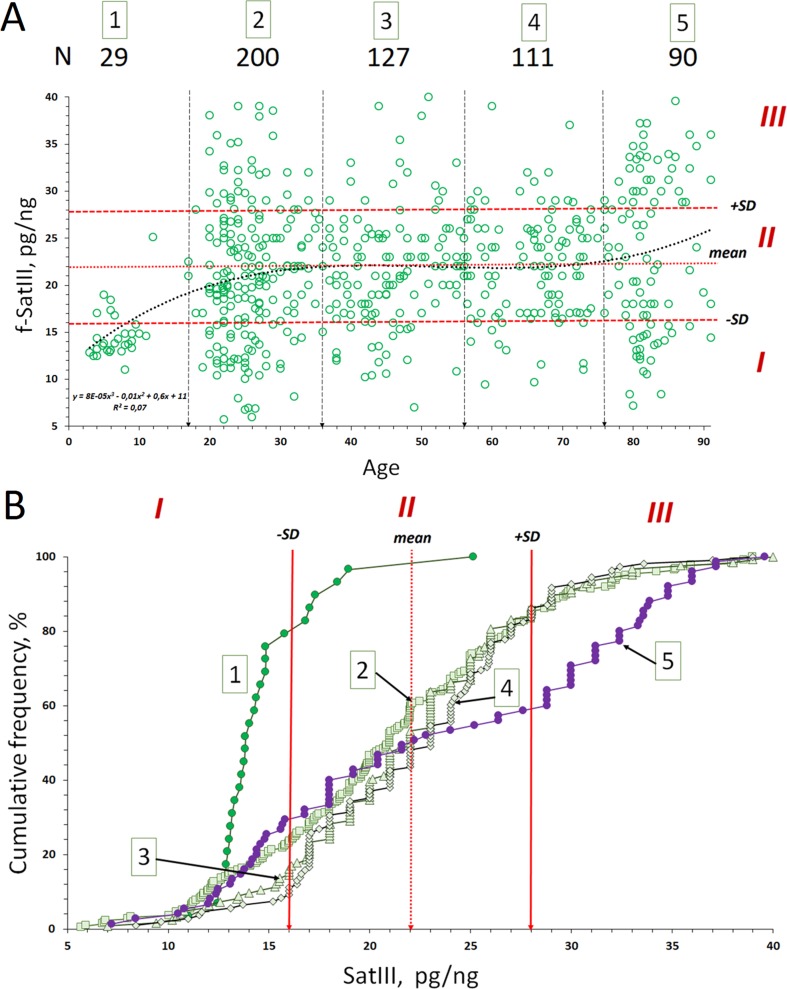
Figure 2.
Copy number variants (CNVs) of f-SatIII in the human blood leukocyte DNA samples with age. (A) Association of the f-SatIII content with the age for the 557 subjects aged 2 to 91 years. The graph shows the area with low (I), moderate (II), and high (III) f-SatIII contents. All the individuals were divided into five age groups ( Table 1A ). (B) Cumulative distribution of the f-SatIII content in groups 1–5 of individuals of different age. Distributions for children (group 1) and for the elderly (group 5) are significantly different from those of the other groups ( Table 1B ).

