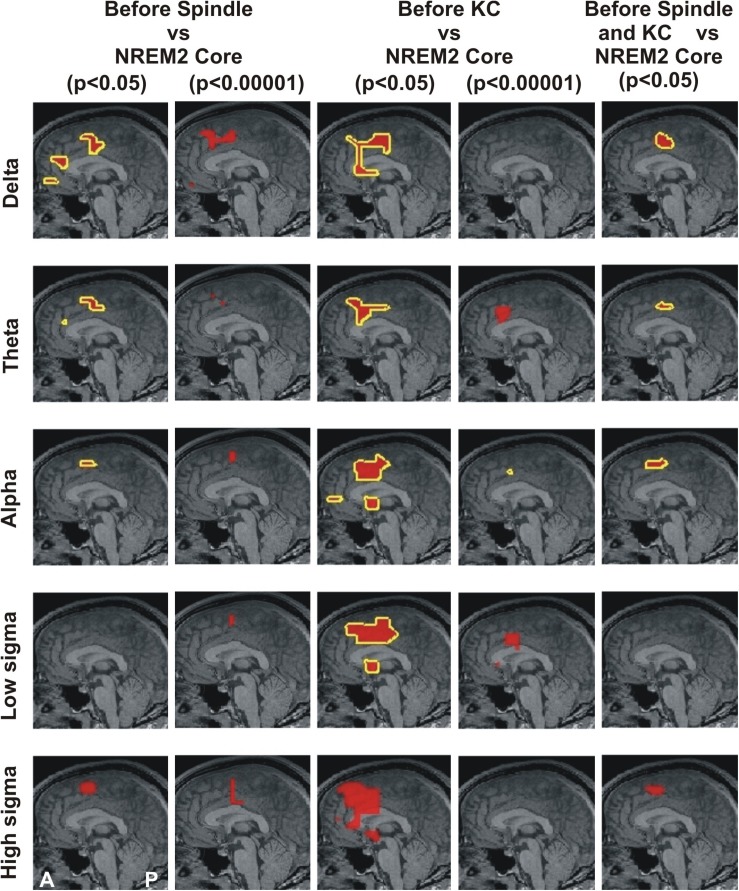
FIGURE 1.
MEG derived tomographic estimates of increases in spectral power before spindles and KC compared to that during the NREM2 core periods. The increases are displayed if they are within 2 mm (on either side) of the displayed midline sagittal cut (Talairach coordinate x = 0). To link the information central to this paper with that presented in Figure 4 of Ioannides et al. (2017), the figure is arranged in the same general way, with each row representing the same frequency band and each column showing the results for a specific combination of POI comparison and statistical significance. The yellow outline denotes common increase in all four subjects. We also display as a the red blob without yellow outline increases in 3 out of 4 subjects in the given comparison and statistical significance, provided there is no other increase with 4/4 subjects anywhere in the brain. The following contrasts are shown: columns 1 and 2 show increases before spindles versus NREM2 control at p < 0.05 and p < 0.00001; Columns 3 and 4 show increases before KCs versus NREM2 control at p < 0.05 and p < 0.00001, respectively. Column 5 shows the area with modest increase (p < 0.05) identified in separate statistical comparisons from non-overlapping POIs for the periods before spindles and before KCs. The same five frequency bands, as defined in Table 2, were used as in Figure 4 of Ioannides et al. (2017): delta (3.2 Hz), theta (6.4 Hz), alpha (9.6 Hz), low sigma (11.2 Hz), and high sigma (14.4 Hz).

