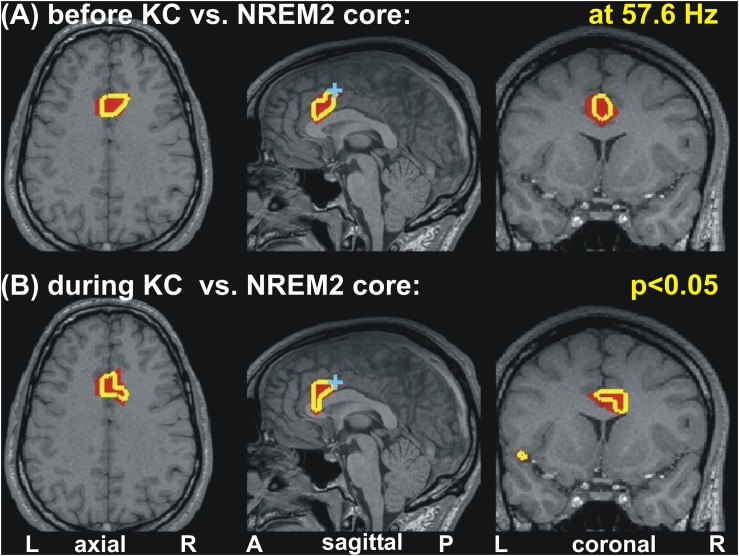
FIGURE 5.
Changes of spectral power at 57.6 Hz before and during KC periods relative to the NREM2 core periods. Modest (p < 0.05) increases are seen in similar part of the anterior cingulate for the periods before (A) and during (B) KCs. A cyan cross in the mid-sagittal cut marks the area (dcACC1) showing prominent increase in upper theta and low alpha band seen before KCs. The axial and coronal cuts are through dcACC1.

