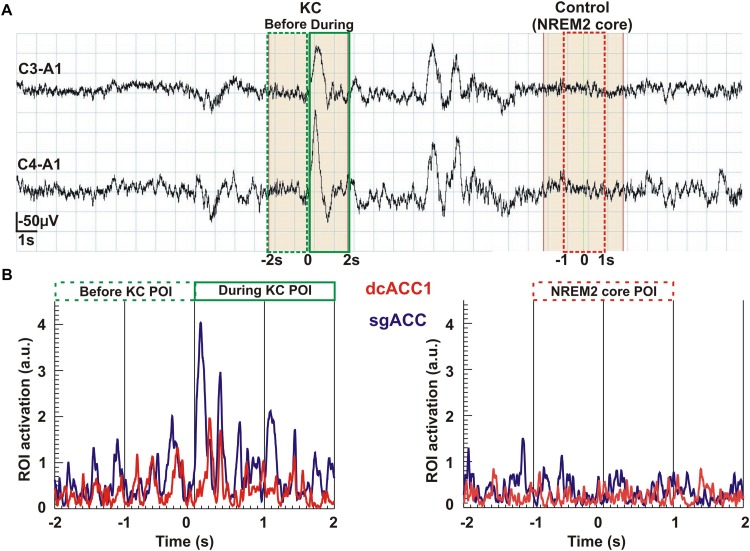
FIGURE 7.
An overview of the analysis from the raw signal and POI selection to regional time courses. The top row Part (A) shows the raw EEG signal (high pass at 0.2 Hz) recorded from the two pairs of electrodes (C3-A1 and C4-A1). In the continuous, 37 s long NREM2 record, two KCs are identified. From this segment of data we selected for further analysis the first (single) KC and a period of NREM2 core, at least 2 s after the second (multiple) KC and with no other spindle or KC after its end for the remaining 6 s of the displayed segment. The beginning of the KC as it appeared in the lower of the two EEG channels was used to mark the middle of a 4 s long segment extracted for further analysis. We applied MFT tomography to analyze independently each one of the 2,500 samples of the single KC and each one of the 2,500 samples of the NREM2 core. We used for the Fourier analysis the 1250 samples in each of three POIs: the first 2 s of the KC defined the pre-KC POI and the last 2 s the during-KC POI. The middle 2 s of the NREM2 shaded 4 s were used as a NREM2 core POI for the further analysis. The spectra for each source space point (about 1000 active points in the source space spread in a uniform grid within the brain) was then computed from the time course of each POI. The sSPM were computed independently for each source space point from the statistical comparisons between the distributions for two POIs, each with eight exemplars for each POI. The results were reported after the conservative Bonferoni correction for multiple source space points was applied. Part (B) shows the time courses for modulus of activity (time-domain description) for the two ROIs (dcACC1 and sgACC) identified in the sSPM statistics as showing prominent changes before and/or during KCs relative to NREM2 core.

