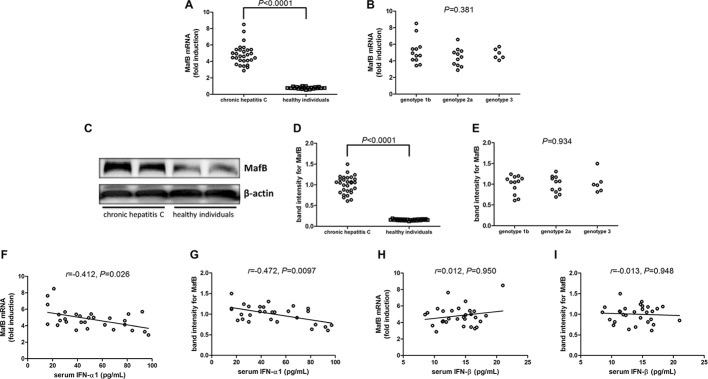
Figure 2.
MafB mRNA and protein expression in chronic hepatitis C patients (n = 29) and healthy individuals (n = 21). MafB mRNA relative level was semi-quantified by real-time PCR. (A) Comparison of MafB mRNA relative level in PBMCs from chronic hepatitis C and healthy individuals. Significances were determined using Student’s t test. (B) Comparison of MafB mRNA relative level in PBMCs from different HCV genotypes. Significances were determined using one-way ANOVA. MafB protein expression was measured by Western blot. (C) Representative Western blot analysis was shown. (D) Comparison of MafB protein expression in PBMCs from chronic hepatitis C and healthy individuals. Significances were determined using Student’s t test. (E) Comparison of MafB protein expression in PBMCs from different HCV genotypes. Significances were determined using one-way ANOVA. (F) Correlation between MafB mRNA relative level and serum IFN-α1 was determined using Spearman correlation analysis. (G) Correlation between MafB protein expression and serum IFN-α1 was determined using Spearman correlation analysis. (H) Correlation between MafB mRNA relative level and serum IFN-β was determined using Spearman correlation analysis. (I) Correlation between MafB protein expression and serum IFN-β was determined using Spearman correlation analysis. Individual level for each enrolled subject was shown.

