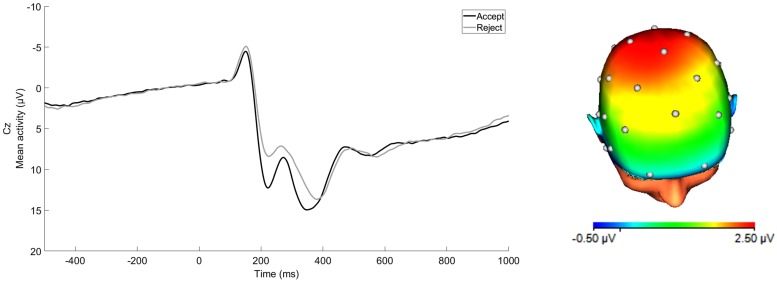
FIGURE 1.
ERP waveform at Cz and scalp distribution at the 250–350 ms time window for average response to acceptance and rejection feedback corresponding to RewP. Scalp distribution reflects the response to acceptance minus rejection difference score. (32-channel montage with linked mastoid reference.)

