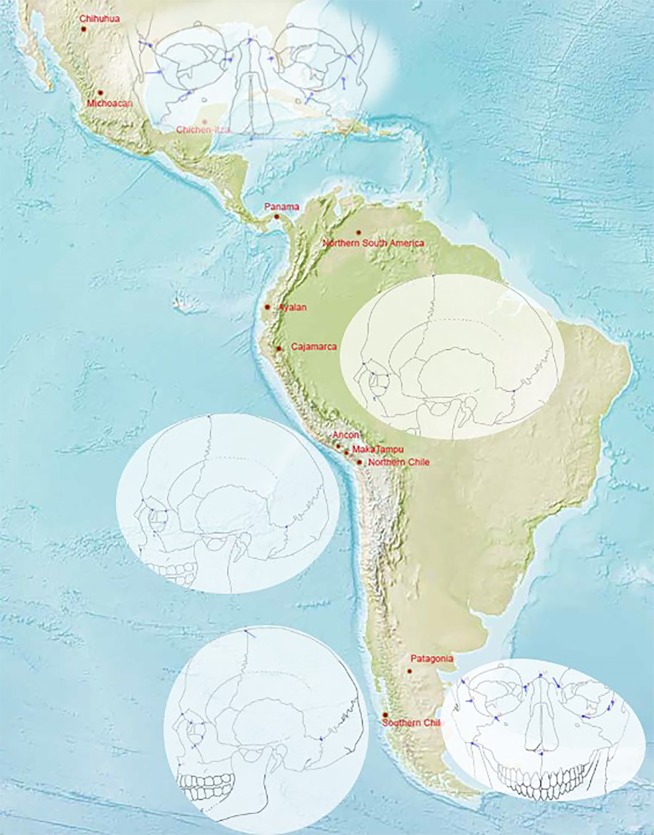
Figure 2.
Map showing location of the samples based on latitude and longitude. Difference vector plots show the direction and magnitude of shape change and are presented for the Peruvian highland (Cajamarca) sample deformed into the Northern Chilean sample, for the coastal Peruvian samples, for the Yucatan Chichen-Itza sample deformed into the coastal sample from Ecuador, for the Southern Chilean sample deformed into the Patagonian sample, and for two Mexican samples (Chichen-Itza and Michoacán). Map adapted from https://www.cia.gov/library/publications/the-world-factbook/attachments/images/large/world_phy.jpg?1558019809.

