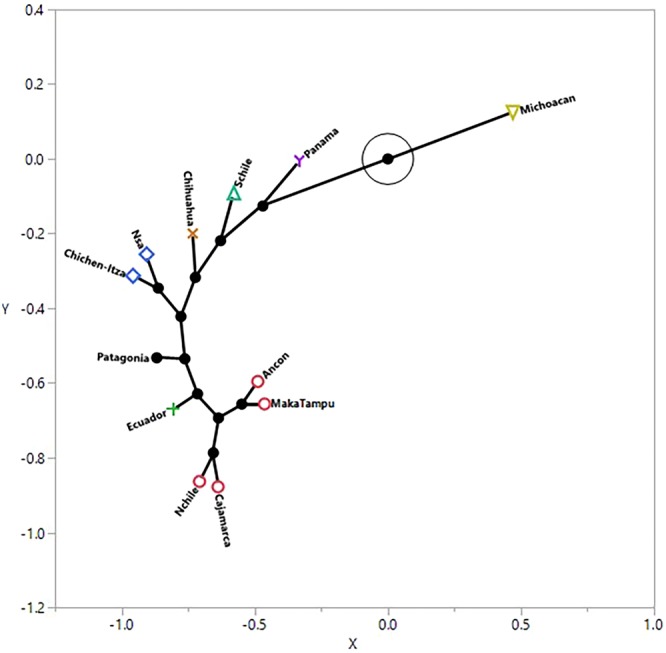
Figure 4.

Constellation plot, which arranges the samples as endpoints, was also produced by the hierarchical cluster analysis. The length of a line between cluster joins represents the distance between the cluster joins and further illustrates the similarity between the two coastal Peruvian samples (Ancon and MakaTampu) and the two highland samples (Norther Chile and Cajamarca from Peru). It also illustrates the similarity between the Northern South America and Chichen-Itza samples (blue) with Michoacán as the most distant or dissimilar.
