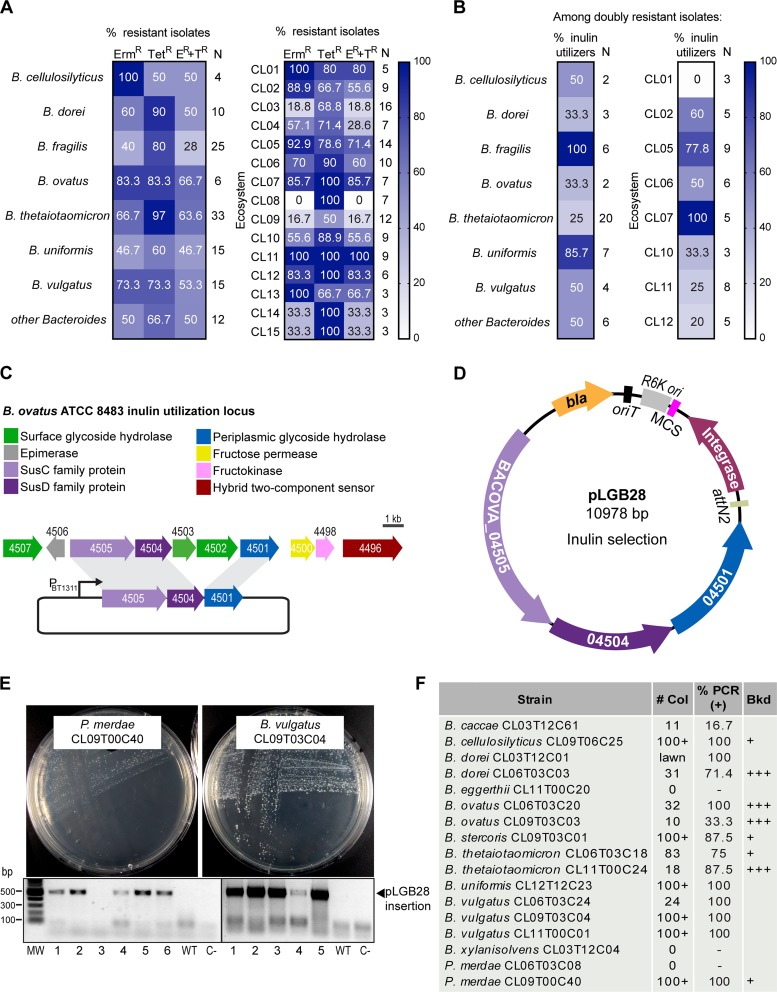
FIG 1.
A minimal inulin utilization locus can be used for selection of integrants in many Bacteroidales species. (A) Percentage of tetracycline- and erythromycin-resistant Bacteroides strains from the Comstock laboratory ecosystems strain collection. Numbers in the right column (N) indicate the number of strains tested. (B) Percentage of inulin utilizers from the doubly resistant (Tetr Ermr) Bacteroides strains. Numbers in the right column (N) indicate the number of strains tested. Ecosystems with fewer than three doubly resistant strains were excluded. (C) Inulin utilization locus of B. ovatus ATCC 8483. PBT1311 is the strong constitutive promoter from the BT_1311 sigma factor of B. thetaiotaomicron VPI 5482 used to drive the expression of the three-gene inulin utilization locus. (D) Integration vector pLGB28 integrates at chromosomal attBT2 sites and allows for inulin utilization selection. bla, β-lactamase gene conferring ampicillin and carbenicillin resistance in E. coli S17; oriT, RP4 origin of transfer; RK6, replication origin in E. coli λpir; MCS, multiple-cloning site; Integrase, IntN2 from NBU2; attN2, recognition and integration sequence. (E) Growth of the indicated strains on M9S-inulin plates to select for integration of pLGB28. Ethidium bromide-stained agarose gels show PCR amplification of the 500-bp fragment corresponding to integration of pLGB28 at attBT2. Six clones are shown per strain. WT, wild type; C−, no-DNA control; MW, molecular weight marker (Quick-Load Purple 1-kb Plus DNA ladder; NEB). (F) Results of the conjugation of pLGB28 into 17 different doubly resistant (Tetr Ermr), inulin-nonutilizing Bacteroides and Parabacteroides strains from panel B. # Col, number of colonies obtained per 13.75 ml of mating culture mix; %PCR (+), percentage of clones that were PCR positive as described above for panel E; Bkd, amount of background growth in the inulin selection plate; +, slight hazy background with distinct colonies (as observed in panel E, left); +++, strong background growth (as observed in Fig. 3B, left).

