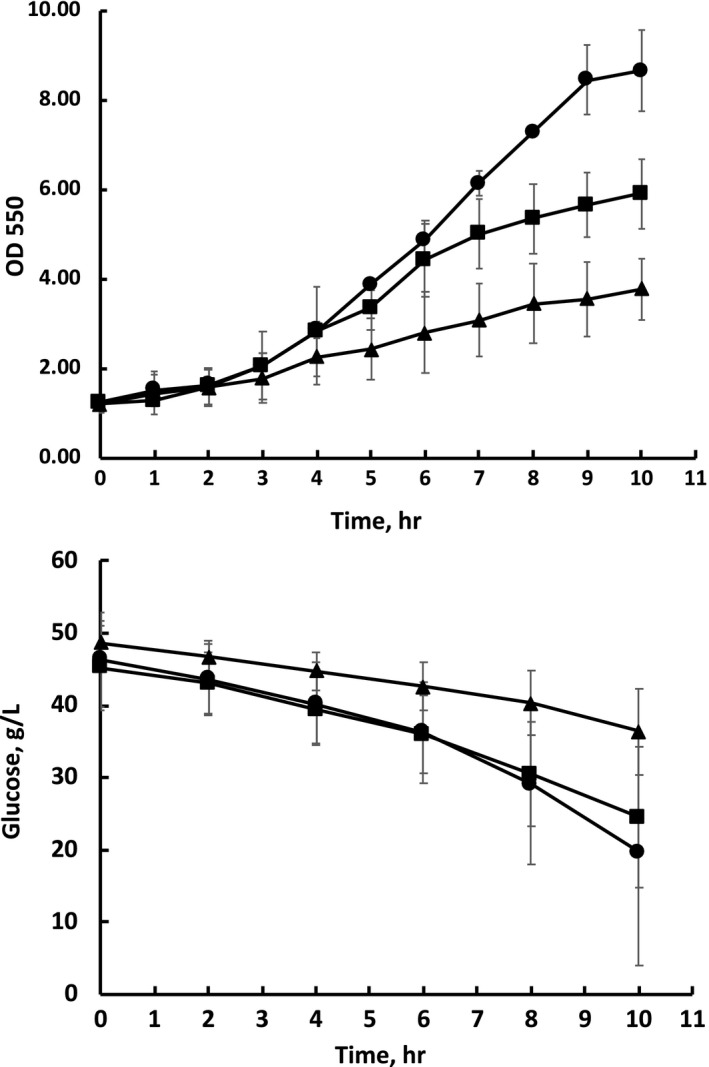
Figure 4.

Growth and glucose consumption of aerobic batch cultures. Circles—Zm6, squares—Pdc‐, triangles – PeriAc. Cultivation took place in 1 L unbaffled flasks with 160 ml of culture on a rotary shaker at 155 r.p.m. Glucose concentration was measured by HPLC (Strazdina et al., 2012). Results represent mean values of three experiments, with error bars showing standard deviation
