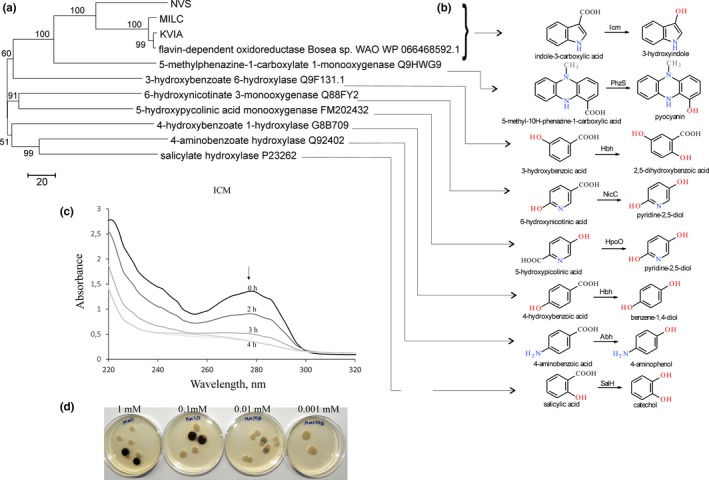
Figure 1.

Characterization of Icm‐KVIA. (a) Evolutionary relationship of decarboxylating flavin‐dependent oxidoreductases. The evolutionary history was inferred using the Neighbor‐Joining method (Saitou & Nei, 1987), the evolutionary distances were computed using the number of differences method (Nei & Kumar, 2000) and are in the units of the number of amino acid differences per sequence. The percentage of replicate trees in which the associated taxa clustered together in the bootstrap test are shown next to the branches (Felsenstein, 1985). The tree is drawn to scale, with branch lengths in the same units as those of the evolutionary distances used to infer the phylogenetic tree. (b) Hydroxylation reactions performed by Icm‐related enzymes. SalH, salicylate‐1‐hydroxylase (EC 1.14.13.1); Hbh, 4‐hydroxybenzoate hydroxylase (EC 1.14.13.64); Abh, 4‐aminobenzoate 1‐monooxygenase (EC 1.14.13.27); PhzS, 5‐methylphenazine‐1‐carboxylate 1‐monooxygenase (EC 1.14.13.218); NicC, 6‐hydroxynicotinate 3‐monooxygenase (EC 1.14.13.114); HpoO, 5‐hydroxypicolinate monooxygenase; Icm‐KVIA, I3CA monooxygenase. (c) Time‐course of consumption of I3CA by Icm producing Escherichia coli cells. Primary spectrum is black; spectra after two, three, and four hours are depicted in brightening gray. (d) Colonies of E. coli DH5α on the plates supplemented with varied concentration of I3CA, blue colonies contain pACYC‐KVIA plasmid, white colonies—an empty pACYC184 vector
