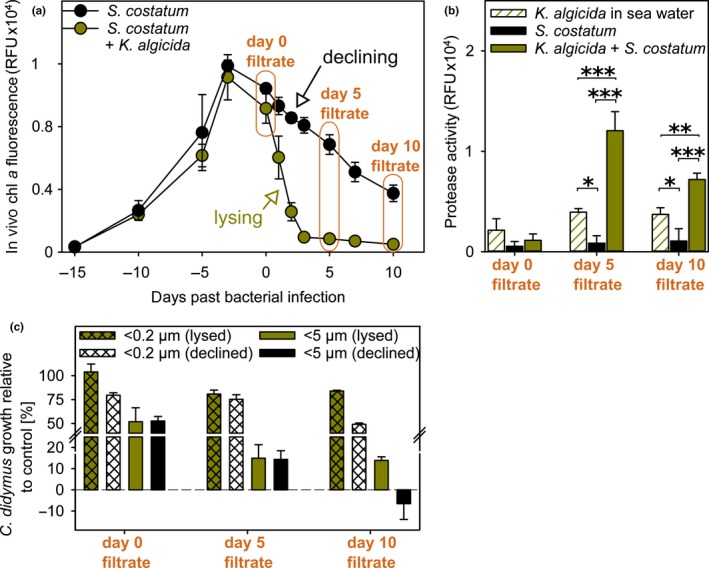
Figure 2.

Impact of declining and bacterial‐lysed S. costatum culture filtrate on C. didymus. (a) Growth curve of S. costatum (± K. algicida infection at day 0) (both n = 3 ± SD). Orange sections indicate the time when filtrate was harvested and further processed by filtration (5 µm and 0.2 µm). Unpaired t tests were performed to obtain significant differences in growth (Table A2aa). (b) Protease activity of K. algicida infected S. costatum filtrates (n = 3) compared to filtrates of K. algicida in sea water (technical triplicates, one duplicate) and declining S. costatum cultures (n = 3). Background level of protease activity (sea water control) were substracted before plotting and statistical analysis (One way of variance analysis (ANOVA), Table A2ab). Asterisks show significant differences compared to the controls. Levels of significance are given as *p < 0.05, **p < 0.01, and ***p < 0.001. (c) Inhibitory activity of filtrates from S. costatum and infected S. costatum on C. didymus growth. Relative growth of C. didymus (% RFU of respective control) after three days of incubation (n = 3 ± SD) was tested for significant differences using unpaired t tests (Table A2ac)
