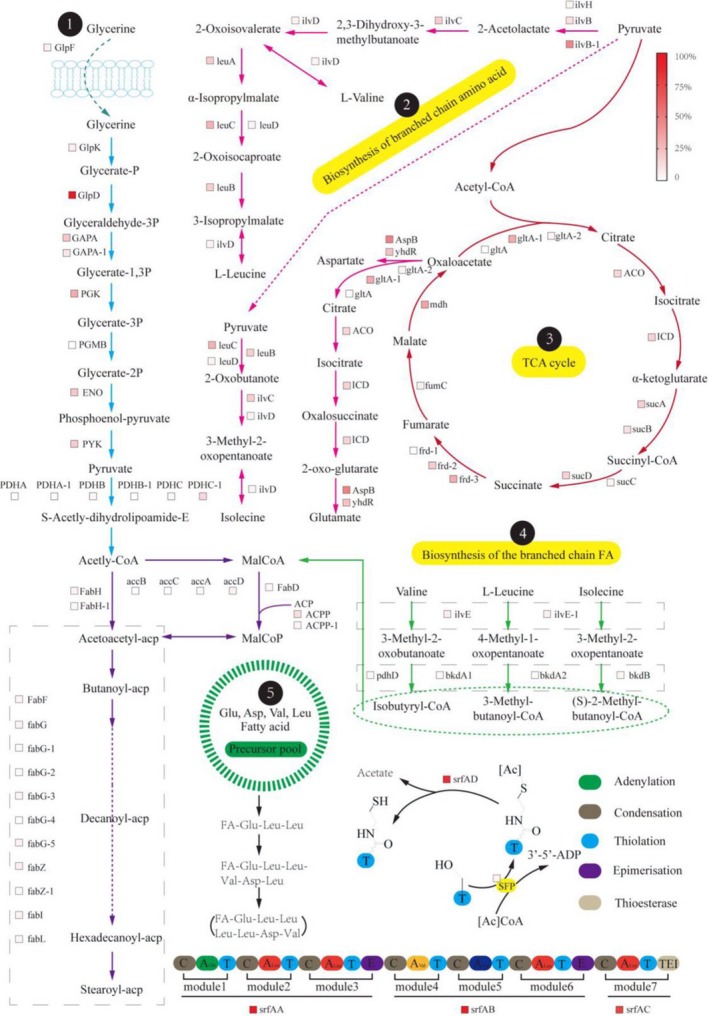
Figure 6.

Metabolic map of the pathways responsible for surfactin biosynthesis. The metabolic network was constructed based on KEGG pathway analysis. Five modules were partitioned according to their functions. 1, 2, 3, 4, and 5, respectively, represent different metabolic modules: 1, glycolysis metabolism module; 2, branched‐chain amino acid metabolism module; 3, tricarboxylic acid cycle module; 4, branched‐chain fatty acid biosynthesis module; and 5, modular enzymatic synthesis of surfactin module. Transcriptional levels of the relevant genes in BS‐37 are show next to the pathway as a heat map, based on the ranking of expression intensity (RPKM) in the whole genome. The color of each square represents the strength of gene transcription. The transcription level (RPKM) of glpD is defined as 100%, corresponding to pure red. The expression intensity of other genes was calculated as the ratio of their respective transcription levels (RPKM) to that of glpD. The culture condition is MMG medium without d/l‐leu. The expression is the ratio of the gene to glpD. In the paper, these have been defined
