
Figure 1.
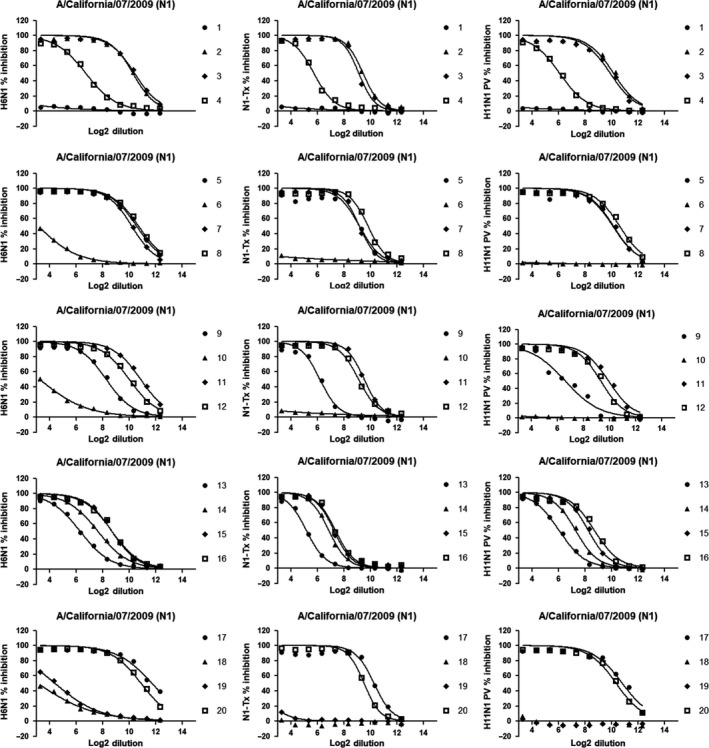
Inhibition curves showing the ability of sera to inhibit sialidase activity across the plate. Sera from 1 to 20 (corresponding to plates 1‐5) were tested in duplicate (GMTs here reported) against H6N1 reassortant virus (left column), N1‐Tx antigen (central column), and H11N1 PV (right column). Y axes represent the percentage of inhibition while X axes report the Log2 of the dilution. The prefix "S1." in front of every serum number is omitted to improve the readability of the legends