
Figure 3.
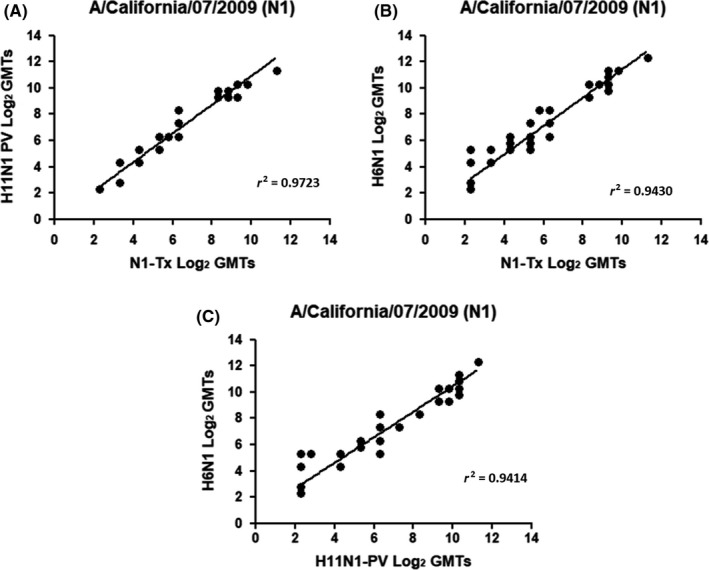
Comparison between (A) wild‐type N1‐Tx/H11N1 PV, (B) wild‐type N1‐Tx/H6N1, and (C) H6N1/H11N1 PV geometric end point titers. Results are represented as Log2 of the end point titer
Official websites use .gov
A
.gov website belongs to an official
government organization in the United States.
Secure .gov websites use HTTPS
A lock (
) or https:// means you've safely
connected to the .gov website. Share sensitive
information only on official, secure websites.
Comparison between (A) wild‐type N1‐Tx/H11N1 PV, (B) wild‐type N1‐Tx/H6N1, and (C) H6N1/H11N1 PV geometric end point titers. Results are represented as Log2 of the end point titer