
Figure 9.
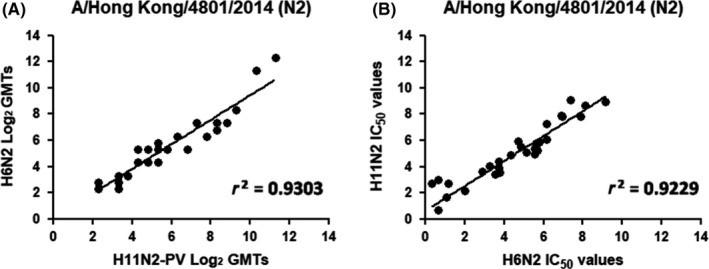
Comparison of NI titers measured in ELLA using H6N2 and H11N2PV antigens. Results are shown as (A) Log2 of the end point titer and (B) IC50 titers
Official websites use .gov
A
.gov website belongs to an official
government organization in the United States.
Secure .gov websites use HTTPS
A lock (
) or https:// means you've safely
connected to the .gov website. Share sensitive
information only on official, secure websites.
Comparison of NI titers measured in ELLA using H6N2 and H11N2PV antigens. Results are shown as (A) Log2 of the end point titer and (B) IC50 titers